Exploring Temperature Change
The Driving Question
 OK,
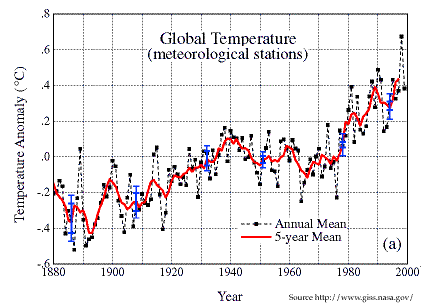
you've heard the hype. According to NASA
scientists global temperature is rising (see figure to
right). However,
if this summary statement is true globally then there must be
some locations
that are increasing rapidly and others with no increase or
even a decrease.
In this lab we explore global warming to answer the following questions:
- Is there an observable change in temperature everywhere
on the globe?
- If not, is there a warming signal that is consistent over
continents,
nations or small subdivisions?
- How do you judge whether a change in temperature is
significant?
Resources Needed
Temperature records are available from the NASA Goddard Institute for
Space Studies (GISS). You are to obtain data for the location specified
below for your analysis.
Instructions
|
NOTE: The
following tasks
are conducted either INDIVIDUALLY (WHITE)
or as a GROUP (YELLOW). |
- Step 1 [Individually]:
- Begin by selecting which continent you will be
analyzing.
The area you study depends on the last digit of your social security
number as follows:
| Last Digit of your SSN# | Your Continent |
|---|---|
| 0-1 | Africa |
| 2-3 | Asia |
| 4-5 | Europe |
| 6-7 | North America |
| 8-9 | South America |
-
Identify others in your Lab working on their same continent and form a group.
- Step 2 [Group]:
- As a group: Go to NASA
GISS Surface Temperature web site.
- Note: Leave "Data Set" setting as "after homogeneity adjustment."
- Note: Leave "Data Set" setting as "after homogeneity adjustment."

|
Click image to go to NASA GISS site for surface temperature data. |
- Step 3 [Group]:
-
As a group: Choose what part of the continent you'll explore. Click on that spot on the NASA GISS Surface Temperature web site. Select one site per person in your group. Make sure the sites are reasonably close together (within say 1000 km) and that each has a reasonably long record of measurement (in right column of output).
- Step 4 [Individually]:
- Individually: obtain plots for the location assigned in Step
#3 by clicking on the name of your location and then click to get "monthly data in table form"
on resulting
plot (lower left corner).

- Step 5 [Individually]:
- Individually download answer template spreadsheets from these
links: Windows (or Macintosh).

- Step 6A [Individually]:
- "Select All" from table obtained in Step #4
-
 Step
6B:
- "COPY" selected data.

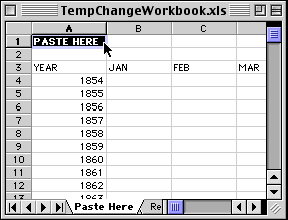 Step 7
[Individually]: :
- Paste into answer template spreadsheet.
 Step
8A [Individually]:
- Select Convert Text to Columns
-
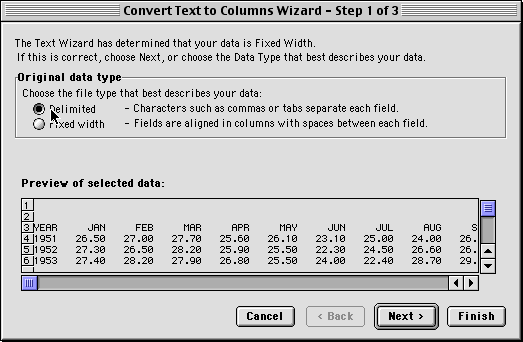 Step
8b:
- Choose "Delimited" as your data type (READ:
It's separated by random spaces, not in fixed columns)
Then click "Next."
-
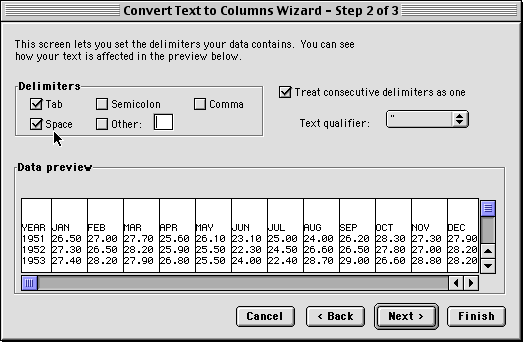 Step
8c:
- Make sure "Space" is clicked (READ: The program looks for
spaces between data to define columns).
Then click "Next."
-
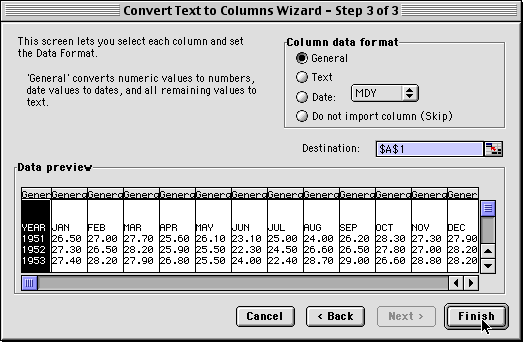 Step
8d:
- Click "Finish."
- Step 9 [Individually]:
- Compare January, April, July and October temperature (scatter) plots. Consider making a scatterplot including all four months and adding trendlines for each month.
- Step 10 [Individually]:
- Determine whether there are significant changes in temperature in
any of the four months.
Significance here is measured by how large the change is over the years for which there are data compared to a measure of the variability (scatter) in the data. In this case the size of the change can be determined by the trendline. The measure of scatter is the standard deviation, which is calculated automatically at the bottom of the monthly plots.
- Step 11 [Group]:
- Compare with others in your group to see if there are
consistent changes between sites.
- Step 12 [Individually]:
- Prepare and hand in via Course Tools:
Write a short essay (as Word™ document) describing the changes in temperature at your site noting the magnitude of the change, variations over time, how changes compare with the standard deviation, and what consistency, if any, was observed between stations in your group.
Be sure to address:- How large was the change in temperature at your site and how consistent was it month to month
- How consistent were the changes observed within your group?
- Do you think the temperature trends you observe in your data reflect a significant change in climate over time? Why or why not?
Grading is based on:
Spelling and grammar (2 points)
- Logical argument and clarity (4 points)
- Structure and flow of writing (3 points)
- Proper reference to site location. Include your graphs. (1 point)
-
References:
-
Easterling, et al., Maximum and Minimum Temperature Trends for the Globe, Science, Vol. 277, No. 5324, 18 July 1997.
Hanson, J.E., Global Temperature Trends: Continued Global Warmth in 1999, 12 January, 2000.
P. Samson, University of Michigan