The Global Water Cycle and Climate Change
(R. Robarts & R. Wetzel, SIL News V. 29, Jan 2000) Jump to: [Global
Water Cycle] [Drought in the Southwest U.S.] [Summary] [Self-Test]
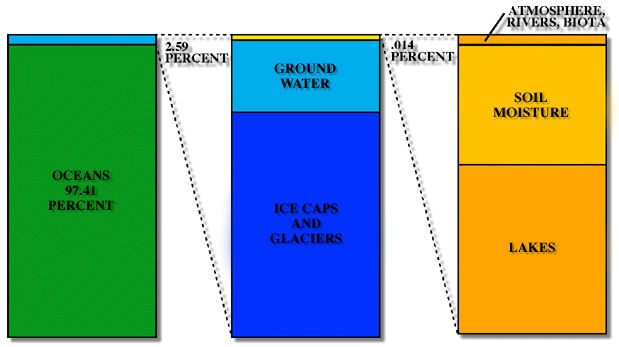
The water cycle contains the largest chemical flux on Earth. Water distributes heat around the globe and thus creates climate, and water is the single most important factor regulating land-plant productivity worldwide. Without water, life would not exist (perhaps on ANY planet), and despite the fact that 70% of the Earth's surface is covered with water, over 97% of that water is salty and can't be used for drinking, agriculture, or industry. Only about 0.014% of the water at Earth's surface is useable by plants, humans, and other animals. What we will learn: 1. What are the major pathways and controls of water movement on Earth – what processes (e.g., evaporation, precipitation) are important? 2. How is rising temperature from global warming affecting the water cycle? 3. How will the interactions between temperature and water cycle processes affect lake levels and drought in the future? In order to understand element cycles as part of the major functioning of ecosystems, it is useful to follow a specific "approach". This general approach was followed in the previous lectures on the carbon and nitrogen cycles, and it can be used to help understand any element cycle. It consists of 3 parts and is formally outlined below:
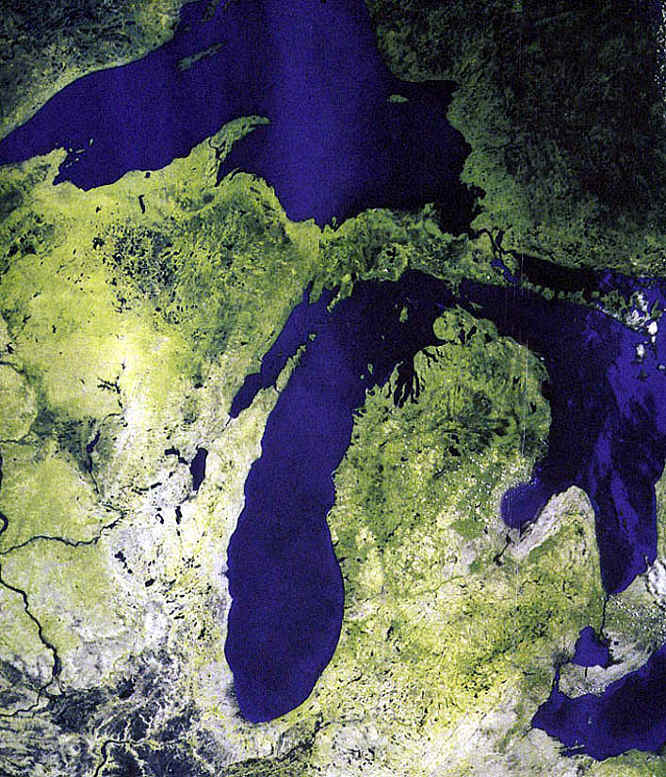
As you can see from the Table and from Figure 2, most of the water on Earth is tied-up in rocks and unavailable (this water is in the mineral grains itself. Of the water that is at the surface of the Earth and available for cycling, only a very small percentage is fresh water. Of that fresh water, about 20% is contained solely in the Laurentian Great Lakes in North America (Figure 1), and another 20% is contained in a single lake in Siberia, Lake Baikal.
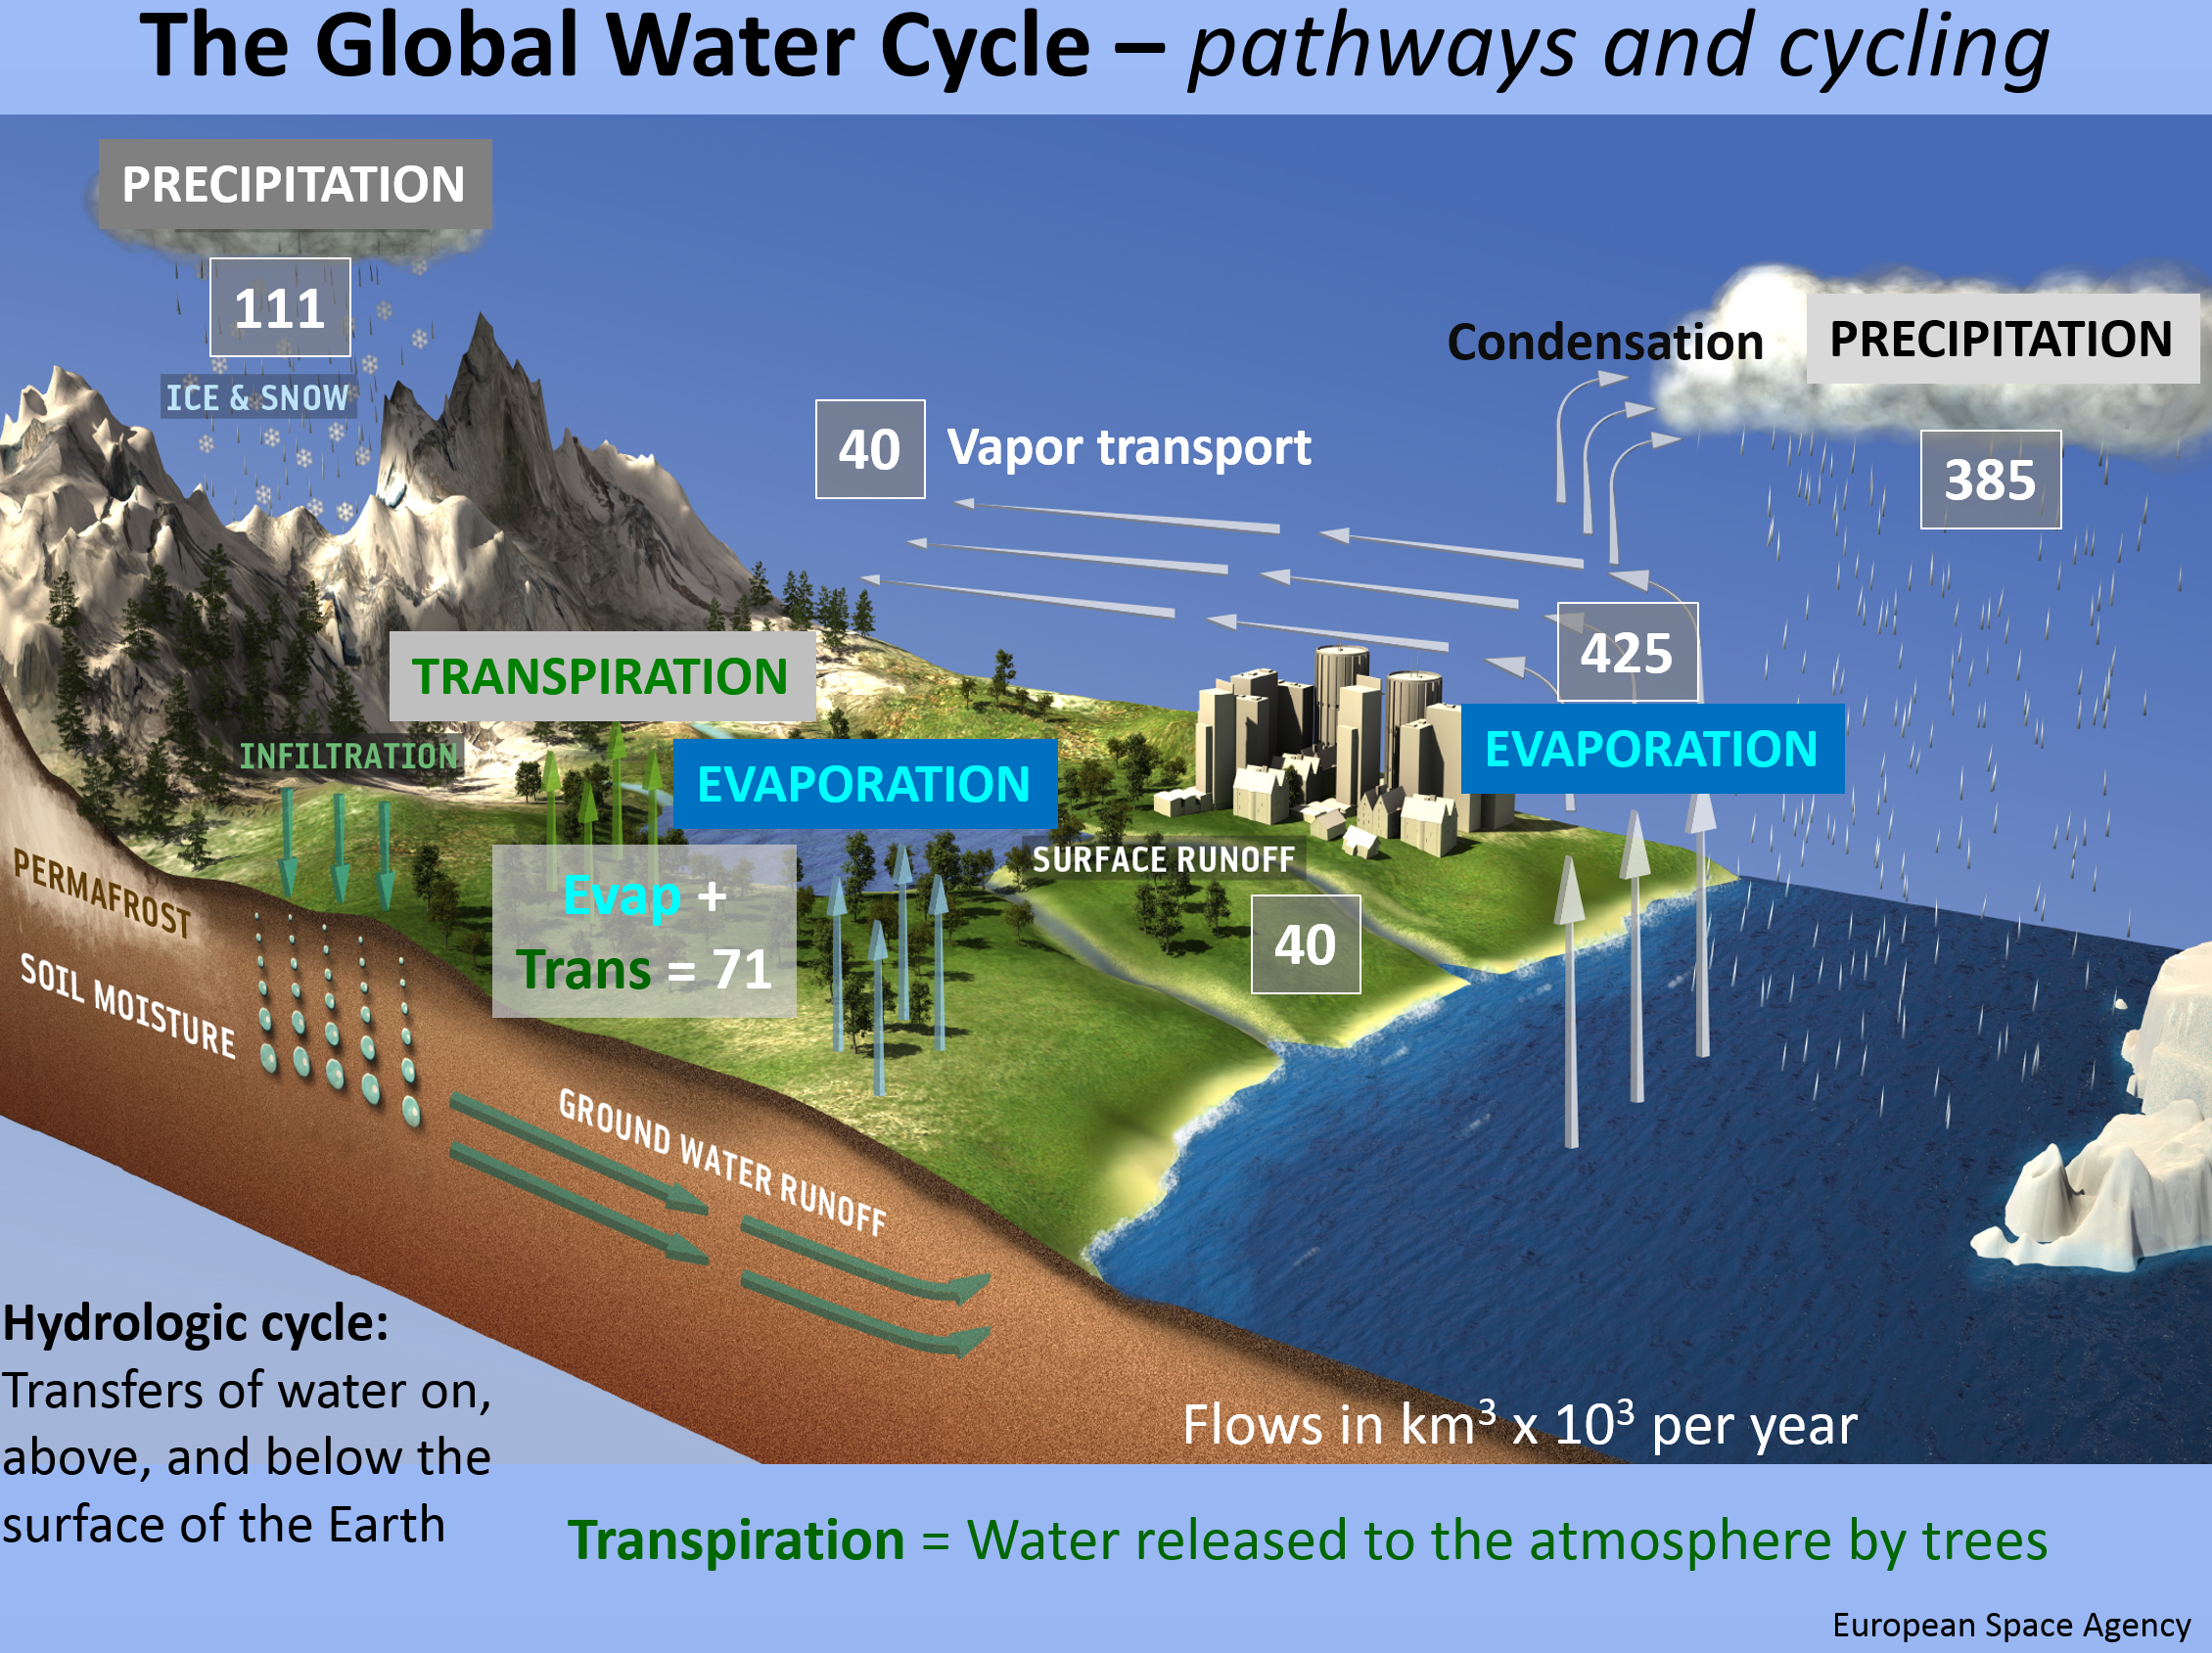
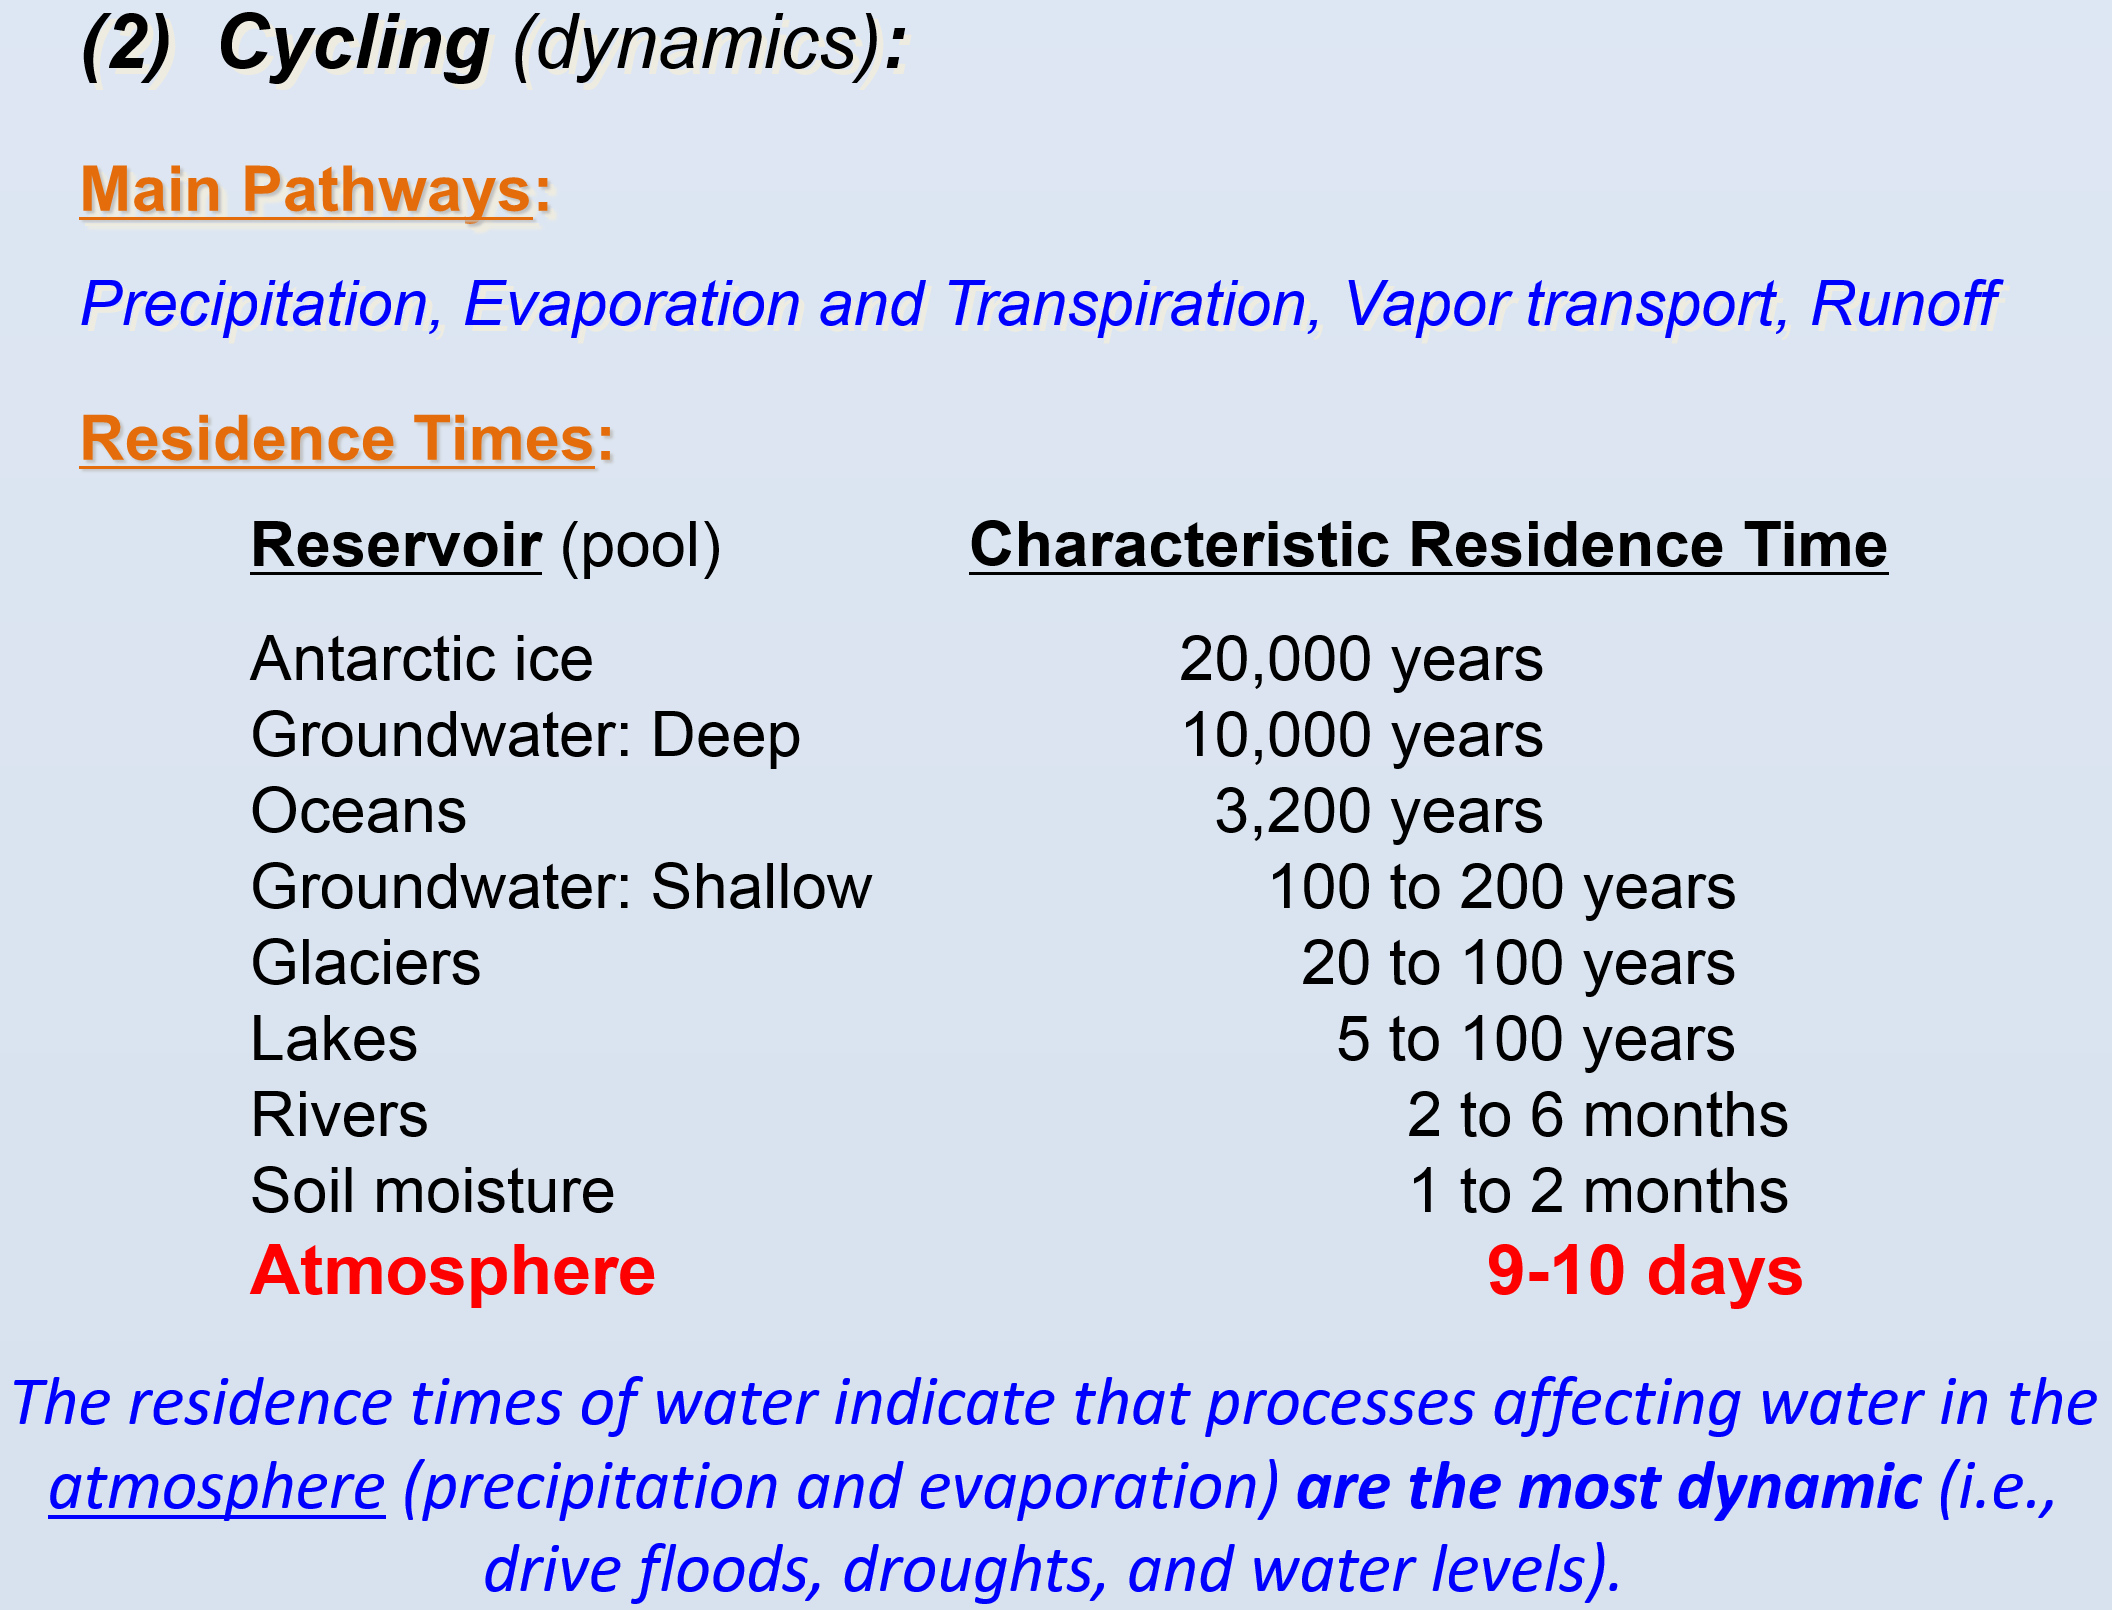
There are 4 major pathways of cycling in the global water cycle (Figure 3): precipitation, evaporation and transpiration, vapor transfer from ocean to land, and return flow called "runoff" in rivers and groundwaters from land to oceans. Transpiration is the movement of water from soils, through plant roots and out the leaves to the atmosphere. The following gives the fluxes of the major pathways: 1. Total precipitation = 496 x 103 km3 / year (~385 over oceans, 111 over land) 2. Evaporation from ocean = 425 x 103 km3 / year 3. Evaporation + Transpiration over land = 71 x 103 km3 / year 4. Vapor transport (ocean to land) = 40 x 103 km3 / year 5. Surface runoff (land to ocean) = 40 x 103 km3 / year The residence times of various pools of water on Earth are shown on the right of Figure 3. Note that ice locked up in Antarctica, and deep groundwater, have the longest residence times and would thus change the most slowly. The ocean water residence time is just more than 3,100 years, calculated as follows: Ocean Residence Time, Rt = (1,350 106 km3) / (0.425 103 km3/yr) = 3,176 years The atmospheric water residence time is the shortest, and less that 10 days (as part of your learning about the water cycle, please take a moment to calculate the atmospheric water residence time following the example above for ocean residence time). This very short residence time of the atmosphere indicates that the main fluxes into and out of the atmosphere (evaporation and precipitation) are dynamic, which is one reason why storms and floods are also very dynamic.
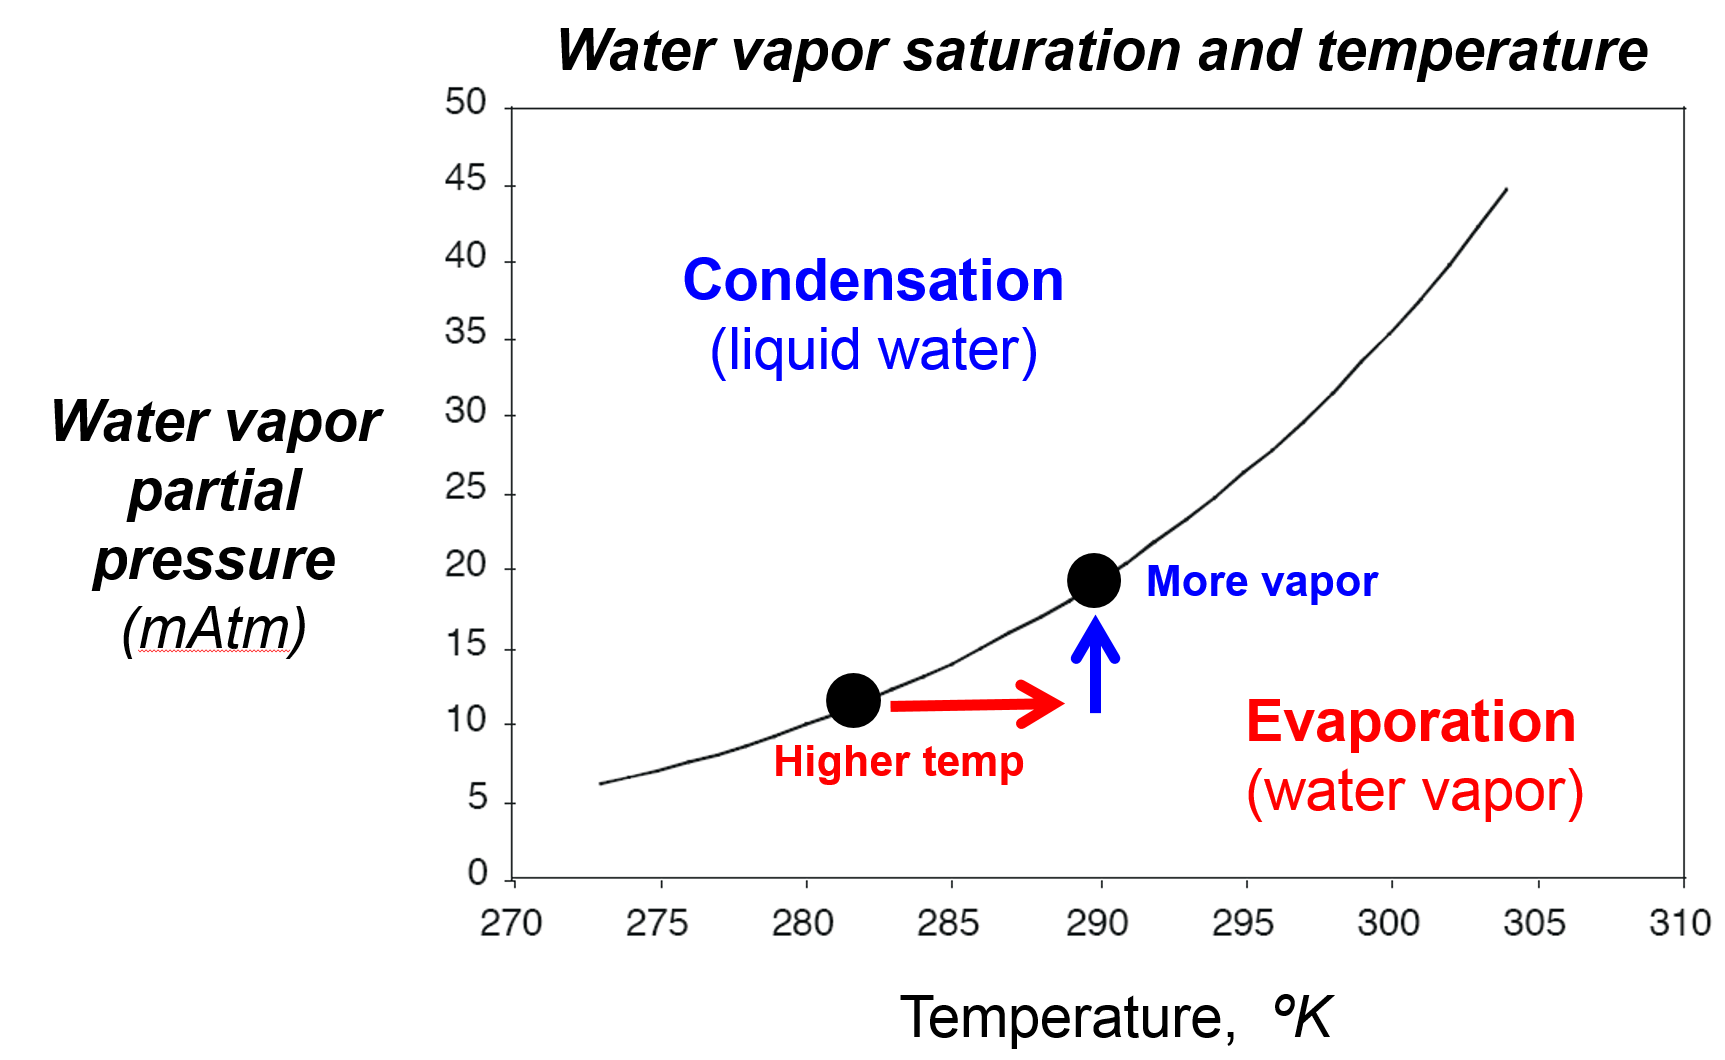
(3) ControlsThere are several major controls on the water cycle, including temperature increases, human consumption, and land use change. In this lecture we will focus on the role of temperature in the water cycle, especially as it affects (1) Evaporation, (2) Lake ice melting, and (3) Drought. The melting of ice from glaciers and ice sheets, and how that affects sea level rise, will be the focus of an upcoming lecture.(A). Temperature. Temperature has a strong affect on evaporation and the amount of water the air can hold. As temperature increases, the rate of evaporation (water changing state from a liquid form to a vapor form) increases - think about setting a glass of water out on a table and putting another glass under a heat lamp - which glass would evaporate its water sooner? In addition, if the air is dry (low humidity or low "water vapor partial pressure") then the rate of evaporation will also be higher. This is because the liquid and vapor states of water are always trying to come to equilibrium, and water will evaporate until the air is saturated with water vapor (cannot hold more) or all the water is gone, whichever comes first. This equilibrium is described in Figure 4 below, and the black line shows the equilibrium between water and vapor at different temperatures. Above the line the water vapor partial pressure is greater than the equilibrium (the atmosphere can't hold that much water), and water vapor condenses to form liquid water droplets. Below the line, the water vapor pressure is undersaturated, and because the atmosphere can hold more water vapor the liquid water evaporates to raise the vapor pressure up to the black line. Finally, note that the atmosphere can hold more water vapor at higher temperatures (think of the last time you felt very "sticky" from high humidity - was it on a cold day or a hot day?). This is a very important relationship, and it is at the center of why increasing temperatures on Earth are causing an intensification of the water cycle. Because warmer air holds more moisture, and because increasing temperature increases the rate of evaporation, when it is hotter out we have greater rates of evaporation and precipitation (rain). [Note that the total amount of water in the atmosphere or the ocean may not change, but the rates of cycling increase at higher temperatures.] Therefore, the greatest evaporation rates are when the weather is hot and dry, and the greatest water vapor amounts (humidity) in the atmosphere are when the weather is hot and wet.
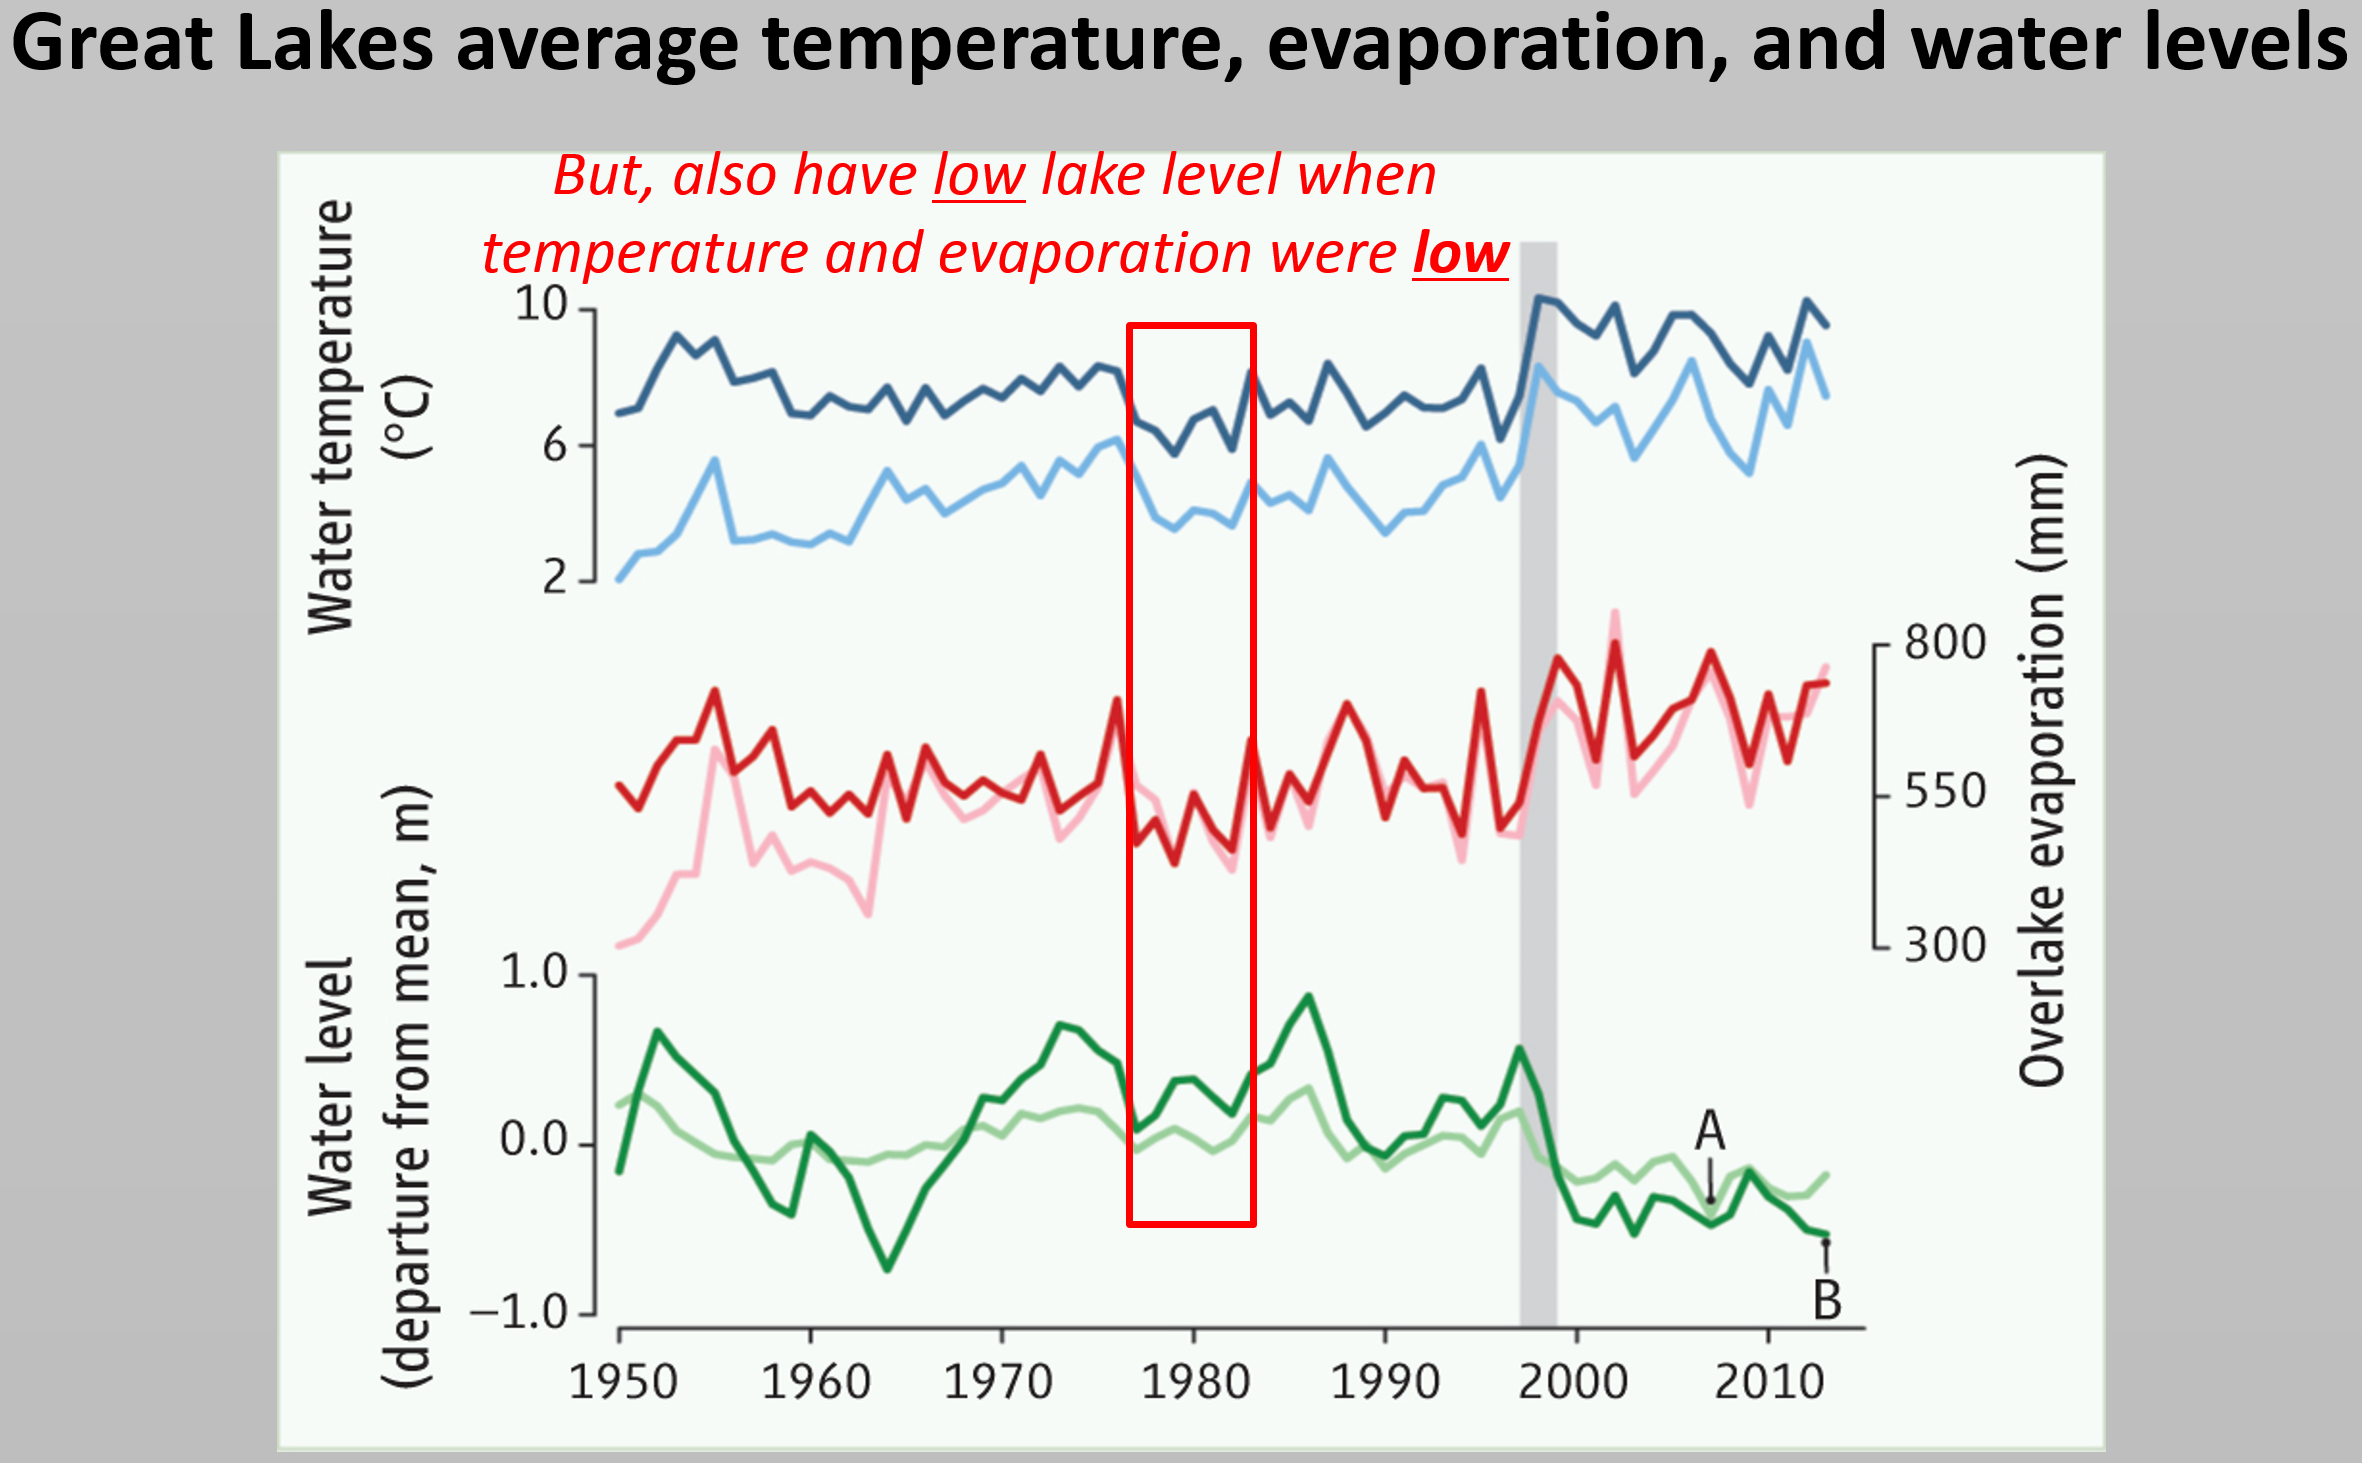
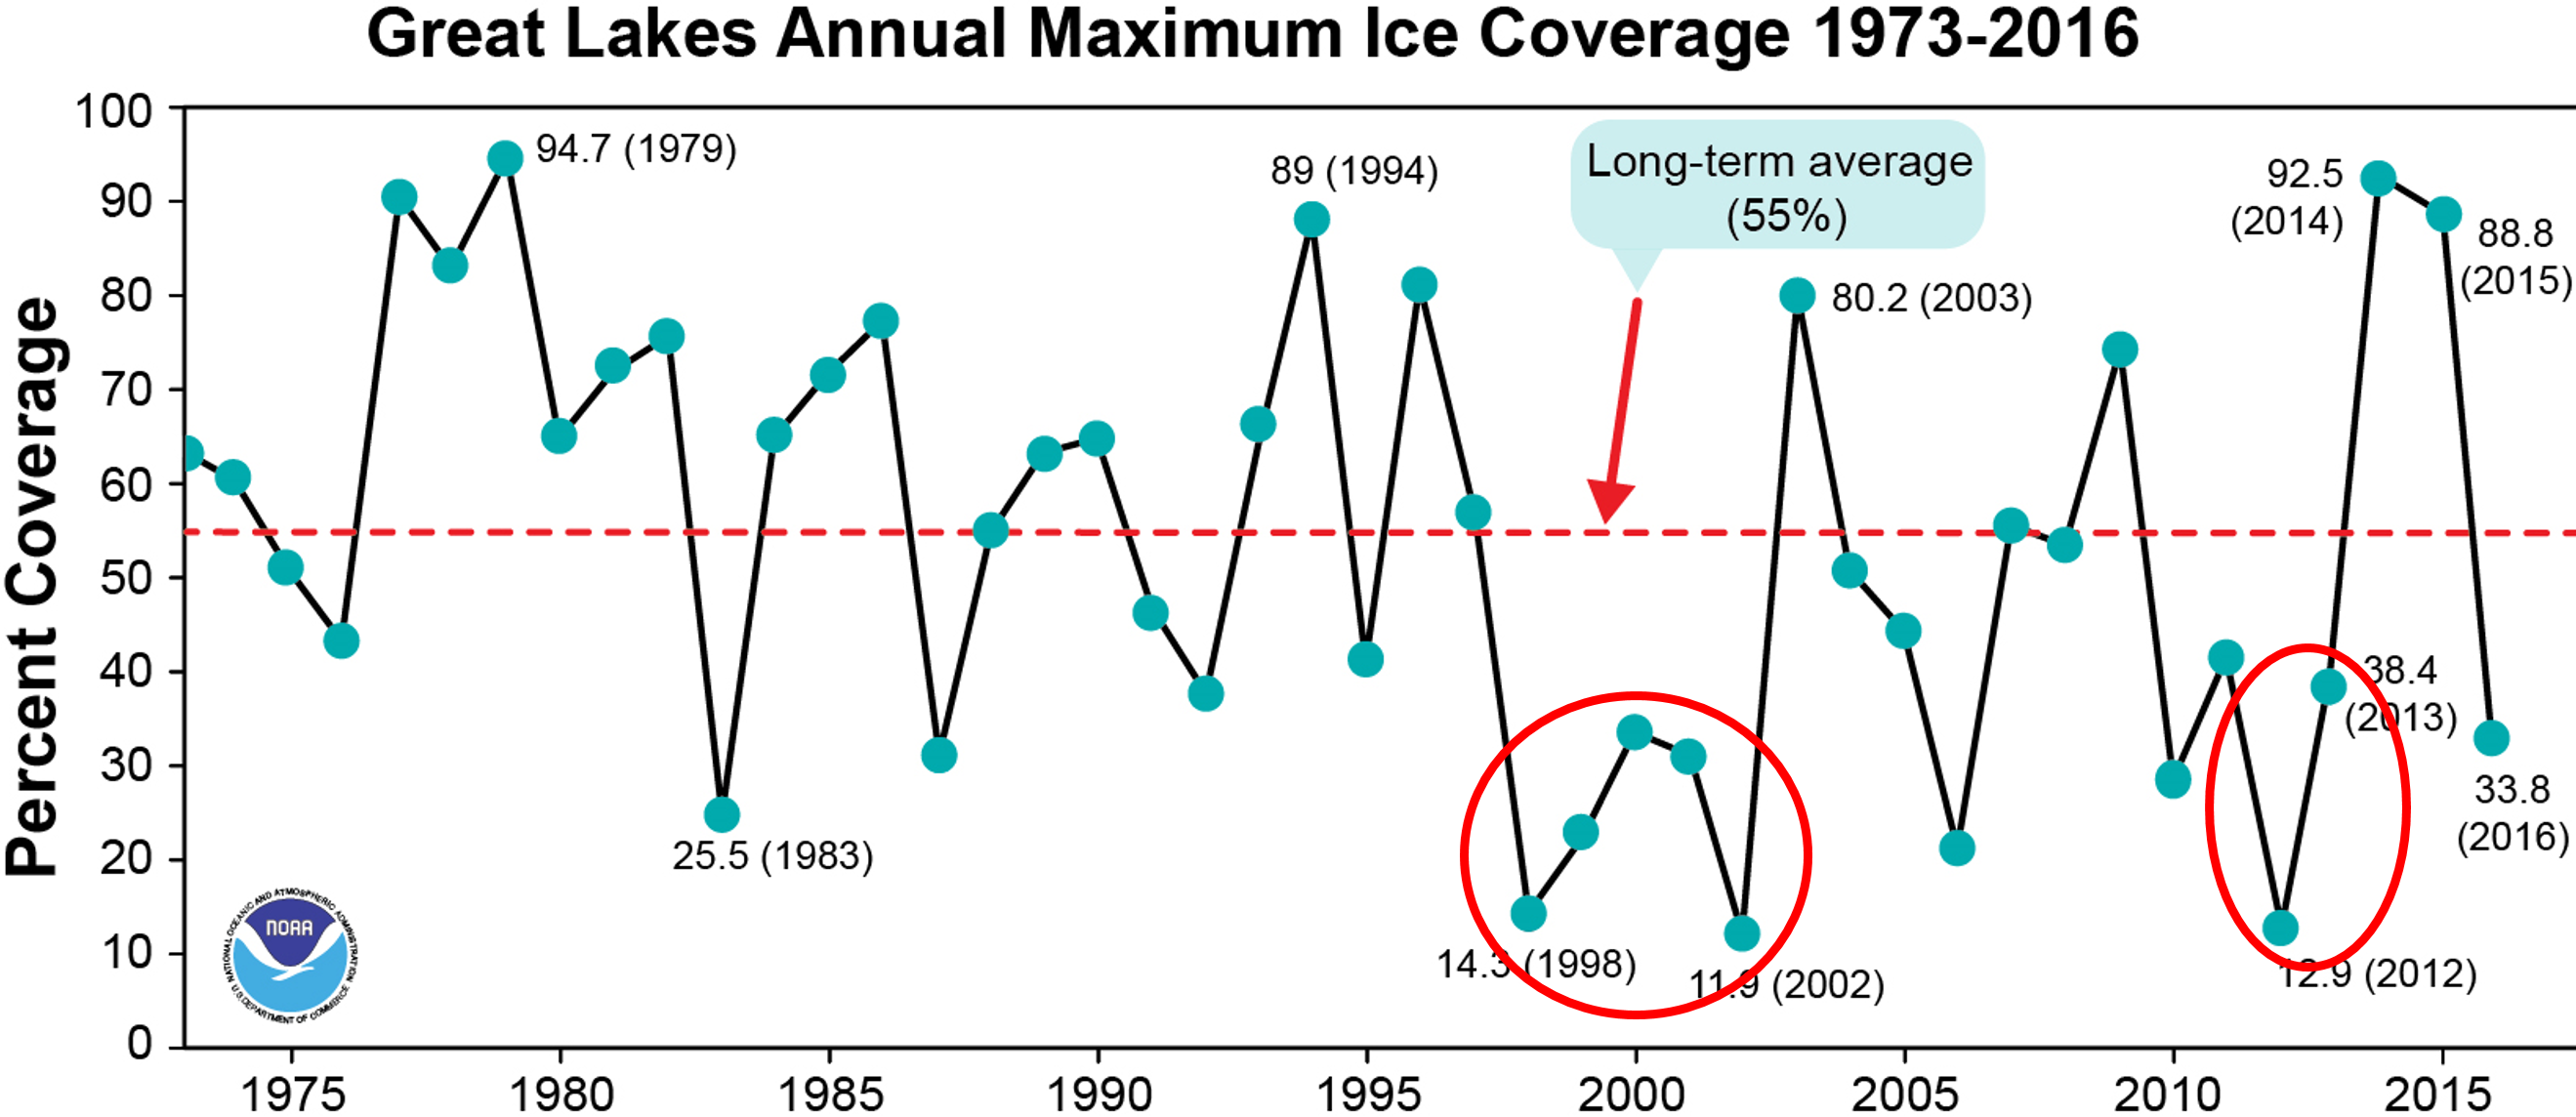
1. The Case of the Great Lakes Water Levels. In 2000 the water levels in the Laurentian Great Lakes were very low, but the precipitation levels were normal that year. This confused scientists because in addition to normal preciptiation inputs the temperatures that year were only slightly warmer, meaning that the lake levels should also have been normal and not extremely low. Because the level of water in a lake (or bathtub) is a simple mass balance of inputs (rain, snow, river inlets) and outputs (evaporation and river outlets or withdrawal), we can examine the components of this mass balance in order to determine why lake levels were low. Examine the data record for the average Great Lakes temperature, evaporation, and water levels shows that the evaporation was indeed higher in the year 200, when lake level was low. However, the fact that we can also have lower lake levels (in the early 1980s) when temperature and evaporation were low, means that another factor must be involved beyond simply the temperature alone increasing evaporation. Until now we have talked about the intensity or rates of evaporation increasing with temperature, but in our mass balance model we must know the duration of the evaporation as well. For example, if there was a longer duration of open water on the Great Lakes in 2000 (i.e., less ice cover), then we would expect more evaporation over the course of the year, even if the temperature was not increased. We know that warmer winters have shorter ice cover, and ice blocks the evaporation of lake water into the atmosphere, meaning that the lake water can evaporate to the atmosphere for a longer period of time. If this integration of components of the water cycle is responsible for Great Lakes water levels, we would expect lower water levels in the years 2000 and 2013 when the ice cover was very short - and that is exactly what we find.
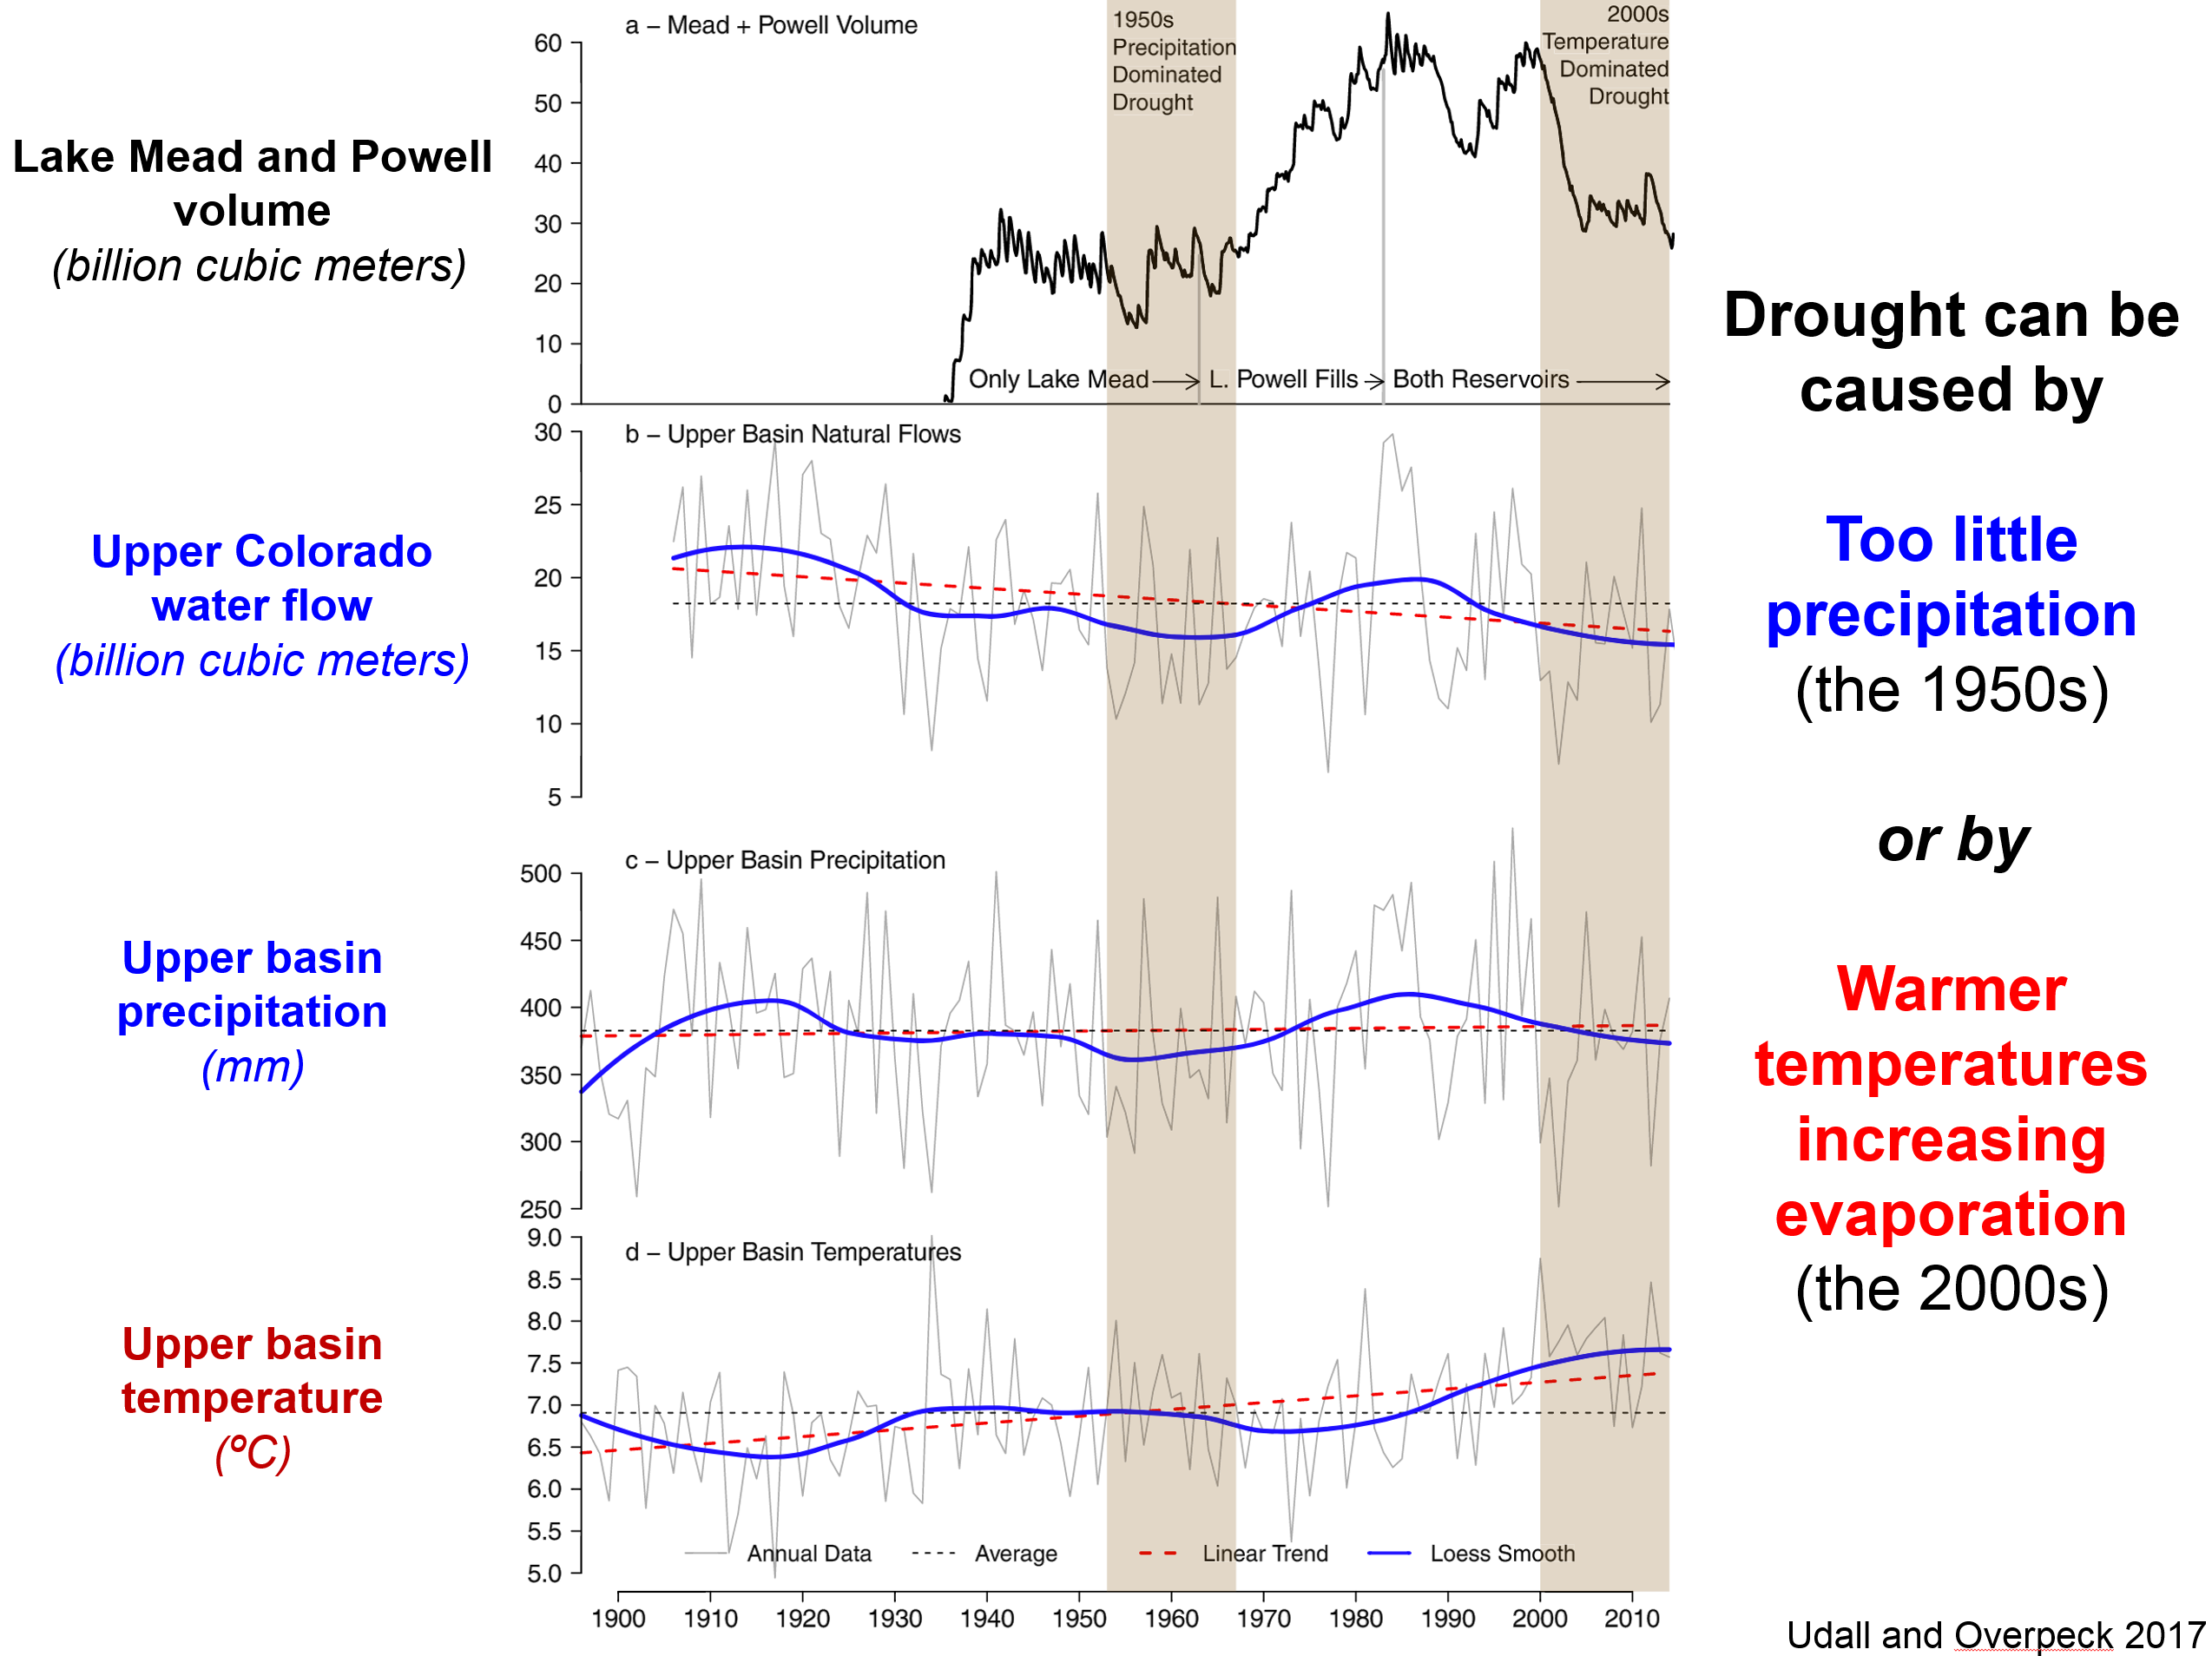
A second example of the intensification of the water cycle concerns drought. Although the severity and extended periods of drought have likely increased worldwide, here we discuss the example of drought in the southwestern United States and specifically in the Colorado River Basin. The key point is that because air temperatures have increased over time due to global warming, rates of evaporation have also increased and that has lowered the levels of water stored in reservoirs. This water shortage is independent of the precipitation amounts, and increasing evaporation that leads to drought will be a continuing problem as global temperatures rise. The droughts seen in the southwestern and western U.S. have been termed "megadroughts" because of their severity and long-term nature. While megadroughts have occured in the past, and are part of the natural variability of climate, on the basis of our fundamental scientific understanding of the water cycle, megadroughts will only become more common or intense in a warmer future world.
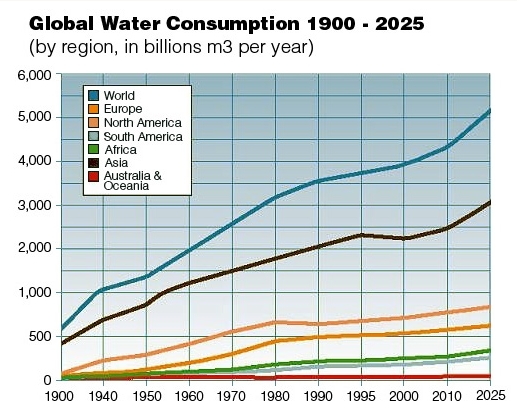
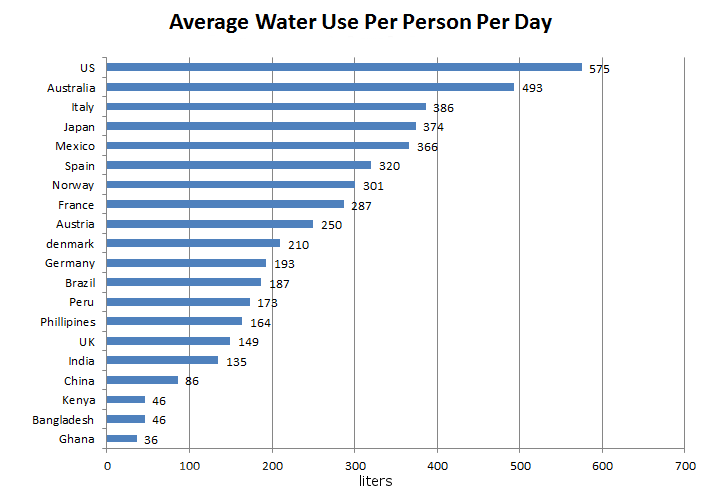
(B). Human consumption. The consumption of water by humans has increased dramatically since the industrial revolution, and today water is a critically lacking resource in certain areas such as deserts and semi-deserts. In addition to this local vulnerability, it is quite likely that water shortages due to human consumption will occur at the regional scale in the near future. For example, the southwestern United States (in all seriousness) has proposed to "buy" water from the Great Lakes states and build a pipeline from Lake Michigan -- so far Michigan, Wisconsin, and other nearby states and Canadian provinces have declined such offers. Globally, the U.S. dominates in terms of the average water use per person, 575 Liters or over 150 gallons per day.
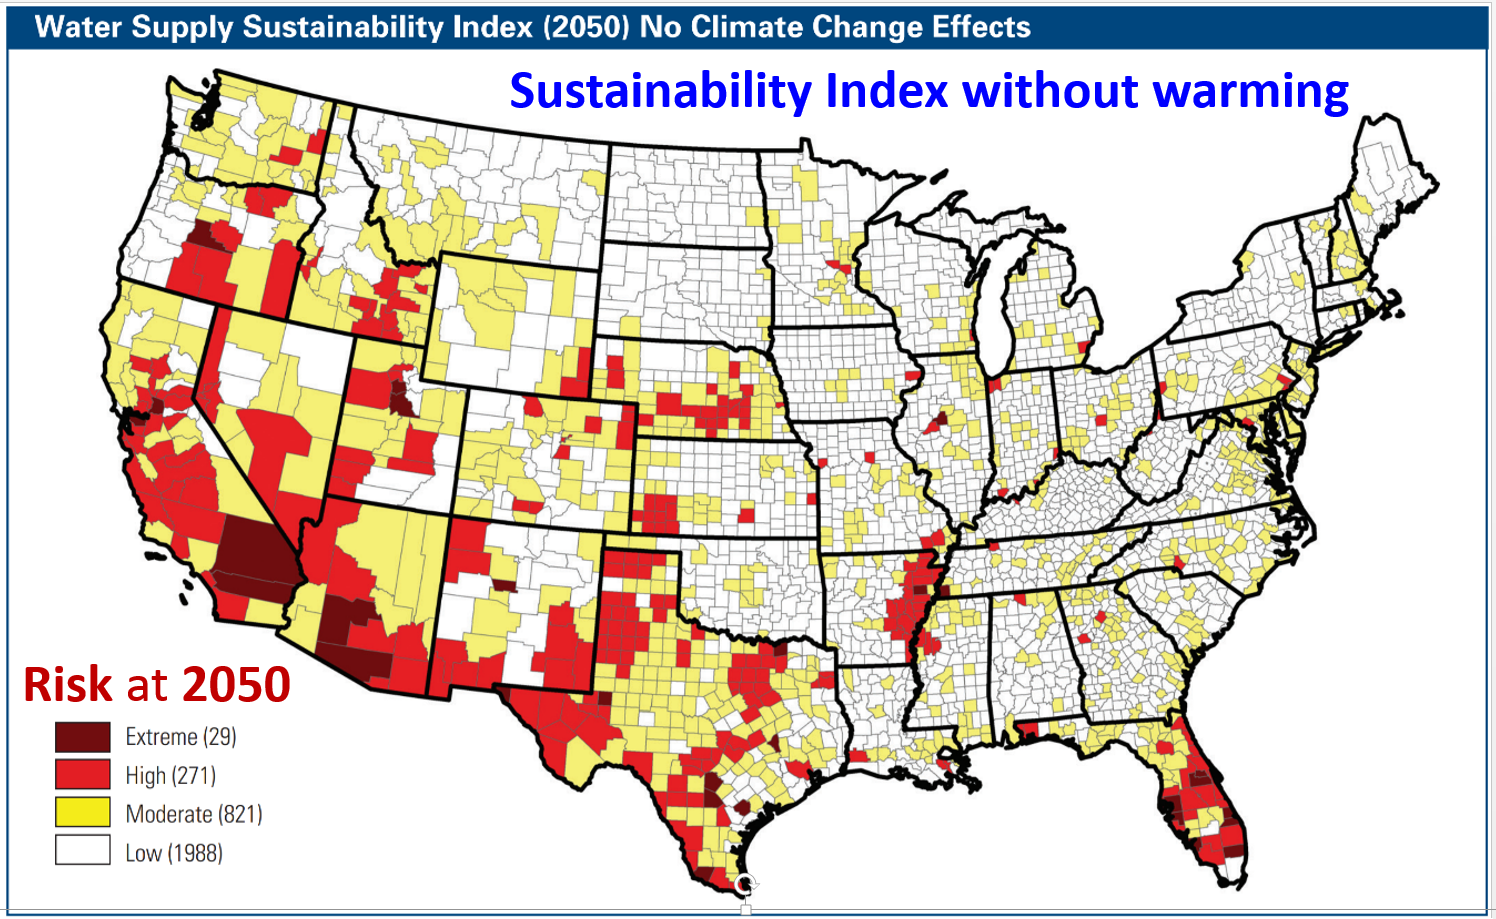
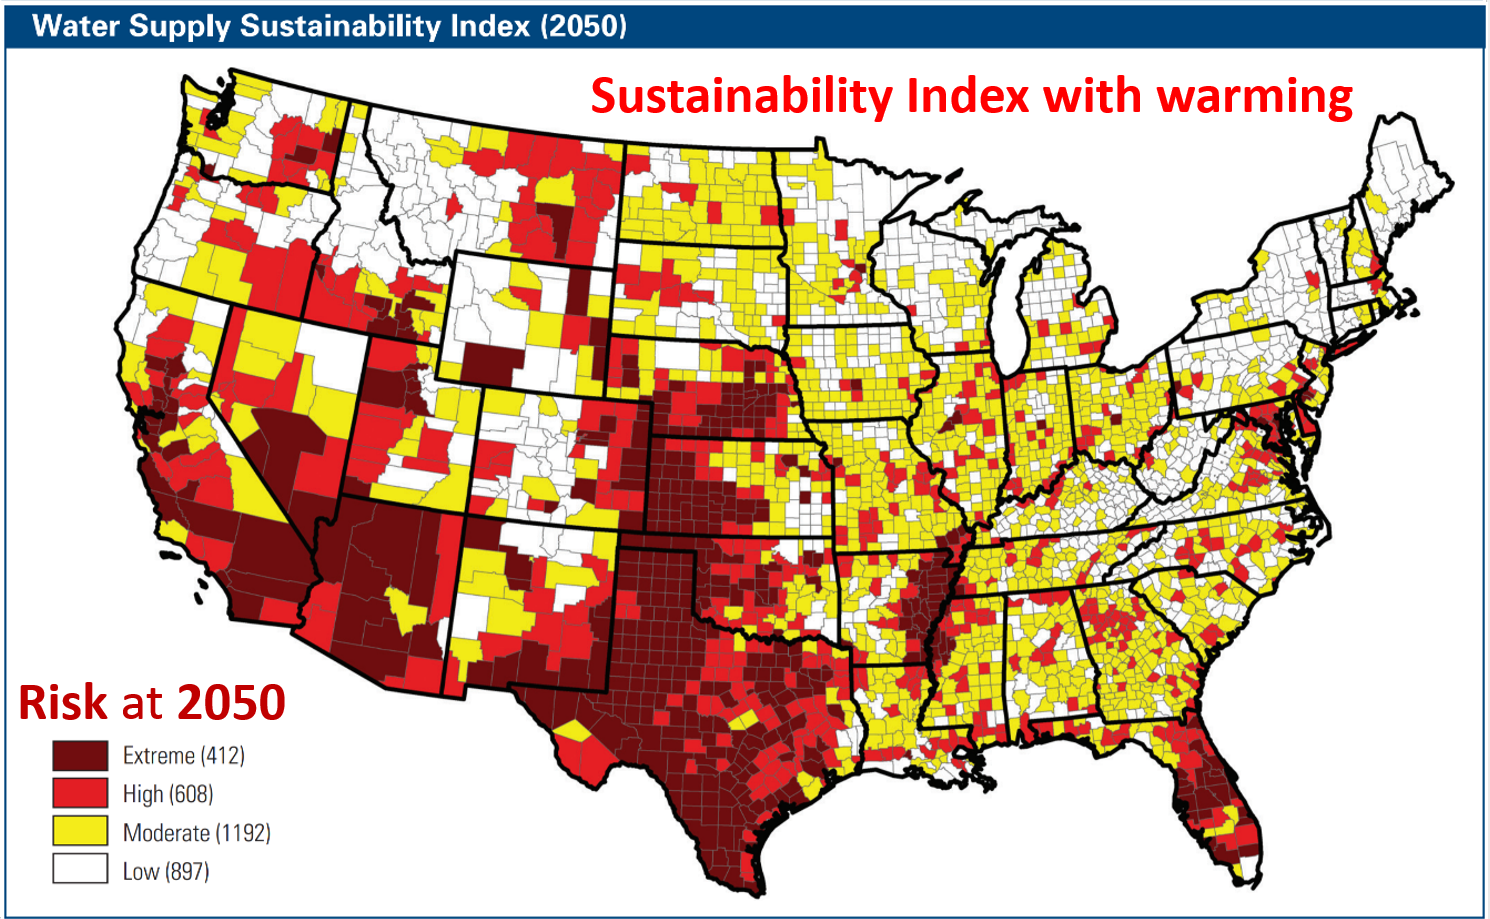
In industrialized countries most water is used for industry (59%) and then agriculture, while in developing countries 82% of water usage is for agriculture. We can define the Sustainability of water use as simply the supply minus the demand. The supply is from precipitation, and the demand from agriculture, utilities, industry, and domestic use. Already today parts of the western U.S. have unsustainable water supplies, and by 2050 (Fig. 9) the risk of unsustainable water supply will increase dramatically, especially when factoring in the increased evaporation at higher temperatures from global warming. While the supply will be reduced, the demand for water is estimated to grow 12.3% from 2000 to 2050.
(C). Land use changes. Currently most of the land use changes on Earth, such as deforestation, are at a local scale. However, it may soon become important at regional scales and for the entire globe in the future. For example, in a study done at Hubbard Brook in New Hampshire, run-off increased by up to 400% after deforestation. Nutrient cycles are strongly linked to hydrologic cycle, and so nutrient export was also increased. These increases are only temporary, however, and the likely end result of such land use changes is that precipitation will be decreased (this will be discussed in more detail in the upcoming lecture on the Tropical Rainforest), and soils will become less fertile. This illustrates one of the key points about element cycles, which is that they are most often linked and it is difficult to study them in isolation. In this example, the water cycle strongly controls the nutrient cycling due to the transport of nutrients in runoff. In what is a particularly striking case, in the Amazon the drainage basin is so large that it makes its own climate, and evaporation in one part of the basin returns as rainfall in another part. However, much of this evaporation moving water into the atmosphere is due to transpiration (through trees), and it has been predicted that increasing deforestation will reduce rainfall and make the climate drier, to the point that rainforest will not be able to grow back. Summary1. Useable freshwater is very scarce on Earth. 2. Precipitation and evaporation are the most dynamic fluxes in the water cycle, and have the greatest short-term impacts on water levels, floods, and droughts. 3. Evaporation rates and moisture holding capacity of the atmosphere both increase with rising temperatures. 4. Increasing temperature is likely the most important control on the water cycle in the future. Higher temperatures will exacerbate problems of greater demands for freshwater (agriculture, energy, municipal) 5. Drought extremes (megadroughts) are predicted to increase in the future. 6. Current demands for freshwater are unsustainable given water availability, and this problem will only get worse if warming continues. The main take-home message for today's lecture is: "Drink water now, while you can...".All materials © the Regents of the University of Michigan unless noted otherwise.
|
||||||||||||||||||||||||||||||||
