Pollution, Acid Rain, Sustainability, and the
Global Nitrogen Cycle
|
| 14 November 2016 | [Global N Cycle] [Acid Rain] [Dead Zones] [Summary] |
What we will learn:
1. How is pollution related to sustainability?
2. What What are the major forms of nitrogen, and what microbial reactions affect these forms?
3. What are the major controls on the global nitrogen cycle, and how does the N cycle impact the carbon cycle?
4. How does "buffering" of acid rain work in soils? [Pollution example #1]
5. How do element cycles interact to both create acid rain and to reduce its impacts on ecosystems?
6. How are lake and marine “dead zones” formed, and can we do anything about them? [Pollution example #2]
This lecture builds on the basic information on processes and concepts of previous lectures, and begins to integrate this information into a more complete understanding, using "systems thinking", of important issues in global change and sustainability in the face of pollution. Here we will focus specifically on the interaction of carbon and nitrogen with respect to the potential for planting trees to draw down CO2 concentrations in the atmosphere, as well as the role of nitrogen in two forms of pollution - acid rain, and the creation of dead zones in lakes and oceans.
An important change in perspective in recent years has been for the business community (both smaller businesses and larger corporations) to rethink their approach to avoiding pollution. Driven mainly by regulations in the past, the "old view" was that preventing pollution for the greater good only came at the cost of lower profit. The "new view" now roughly equates pollution with waste and inefficiency, in that sustainable practices increase efficiency (that is, cost savings), and thus provide long-term security for the operation.
This has led to "Pollution Prevention" (a.k.a. P2), the reducing of pollution in all forms, as an increasingly important gateway step to sustainability. For example, P2 is now found as the first entry in many organizational plans for sustainability, such as those for the EPA, the National Park Service, State and City governments, and various Cultures (e.g., Indian Health Service). In addition, there is more research on designing policies that solve more than one problem at a time, for example, designing management and policy solutions for climate change, air pollution, and energy security together. This is essentially the same "systems thinking" that we have discussed in this class in many lectures, and we will take that approach today in learning about how the global nitrogen and carbon cycles interact.
In attempting to understand element cycles as part of the major functioning of ecosystems, it is useful to follow a specific "approach". This general approach was followed in the previous lecture on the carbon cycle, and it can be used to help understand any element cycle. It consists of 3 parts and is formally outlined below:
- 1st - Accounting: Accounting tells you "where things are," or the distribution of the element in different pools within the ecosystem.
- 2nd - Cycling: Cycling tells you "where things are going," and how fast they are moving from different pools in the ecosystem.
- 3rd - Controls: Determining the controls tells you "how does the system function, and what factors drive the cycling."
Using this approach of gaining knowledge about each of these three components enables you to answer the question of "How will things change?". Gaining this kind of a predictive understanding of ecosystems, or of communities or populations, is the most important goal in basic scientific research. In other words, if we cannot predict how a system will respond to changing conditions (e.g., a disturbance or altered climate), then we lack a sufficient understanding of the underlying mechanisms and processes that control the behavior of the system (or the community or population). Thus our goal in science is always to have a mechanistic understanding of how the world works.
The cycling of nitrogen is different from the cycling of many other elements because the "chemical forms" of nitrogen are more varied. The nitrogen cycle is complex then in part because of these chemical forms such as: Organic-N; NO3 (nitrate); NH4 (ammonium); and the gases N2, N2O, NO + NO2 (= NOx, pronouced "nox") that are commonly found in the atmosphere. Figure 1 below gives an overview of the global nitrogen cycle and the main fluxes of nitrogen between pools on Earth, the oceans, and the atmosphere.
|
Figure 1. The Global Nitrogen Cycle |
Accounting
Just as we did for the carbon cycle, our first step in understanding the nitrogen cycle is to examine the distribution of N on Earth. The Table below gives the distribution of N in x1015 grams. Notice in the Table below that the largest pool of available N is in the atmosphere.
| Rocks and sediments | 190,400,120 (deep, unavailable) |
| Atmosphere | 3,900,000 |
| Ocean | 23,348 |
| Soils | 460 |
| Land plants | 14 |
| Land animals | 0.2 |
| In the Atmosphere: | |
| N2 | 3,900,000 |
| N2O | 1.4 |
| NOx | 0.0006 (less than 1 billionth %) |
Cycling
The pathways and the reactions involved in the nitrogen cycle are also more complicated than in the carbon cycle due, again, to the fact that there are many different chemical forms. The major pathways are shown in Figure 1, and these pathways can be linked to specific chemical reactions that are listed below and shown in Figure 2.
-
N2 to organic-N; called "N-fixation" (plants and humans)
-
Organic-N to NH4+; "mineralization" (by bacteria and fungi)
-
NH4+ to NO3- , producing NO and N2O; "nitrification" (by bacteria)
-
NO3- to N2 , producing N2O; "denitrification" (by bacteria)
-
NO3- & NH4+ to organic-N; "photosynthesis" (uptake by plants)
|
Figure 2. A diagram showing the main reactions of the nitrogen cycle, and the conditions under which they occur. Note that we start in the upper left by removing N2 gas from the atmosphere in nitrogen fixation, and the N2 gas is eventually returned to the atmosphere (lower right) by the process of denitrification. The diagram highlights how certain reactions such as denitrification only occur in anaerobic (anoxic, or without oxygen) conditions. |
Nitrogen Fluxes (with respect to the atmosphere). Given the information
above, we can calculate some of the fluxes of various nitrogen chemical
species and their residence times in the atmosphere.
1.
N2
output from the atmosphere = 158 x 1012 g / year (N-fixation)
* RT
of N2 = 24.68 million years
2.
NOx
output from atmosphere = 60 x 1012 g / year
* RT
of NOx = 0.01 yr = 3.6 days
·
Note
that small pool sizes of a compound often mean that the compound is
converted to something else quickly, or, that it is very
"reactive". Large pool sizes are difficult to "disturb";
an example is the pool of N2 gas in the atmosphere - because N2 gas has a residence time of more than 24 million years, it is very difficult (that is, it takes an extrememly long time) to change the stock of N2 gas in the atmosphere.
Controls
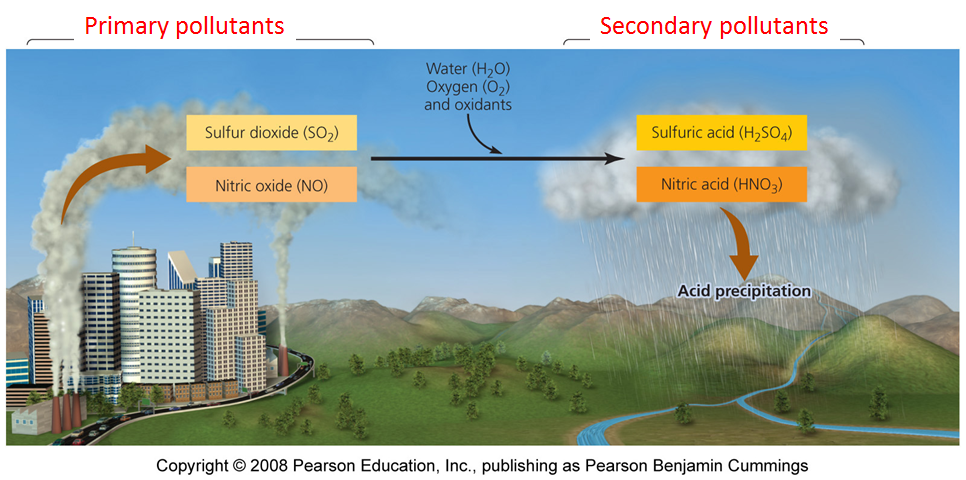
There are very many "controls" on the overall nitrogen cycle, but in this lecture we will focus on the controls that are related directly to a major environmental problem on Earth, which is acid rain. The general way in which acid rain is formed is given in Figure 3 below.
|
Figure 3. Diagram of the pathways and reactions leading to the formation of acid rain in our atmosphere. Note that the primary pollutants are sulfur and nitrogen oxides put into the atmosphere, and the secondary pollutants are the sulfuric and nitric acids that form acid rain. |
· Nitrogen Oxides, NOx
- produced by combustion of fossil fuels and by industry. Important in
forming acid rain, for example with the following reaction that occurs in the atmosphere:
1. NO (Nitric oxide) + O3
(ozone) = NO2
2.
NO2
+ OH = HNO3 = "nitric acid"
3.
In water, HNO3
dissociates (breaks apart) to give H+ and NO3-
(note that the charges must balance, so there is one positive and one
negative charged ion after the dissociation.)
·
The
second important reaction involved with acid rain is the formation of
sulfuric acid in the atmosphere, starting from the input of sulfur dioxide emitted by the burning of fossil fuels and by industry. Once formed, sulfur dioxide is converted into sulfuric acid, which then dissociates as follows:
1.
H2SO4
dissociates in water to give 2 H+ and SO42- .
Thus, the cycles of nitrogen and sulfur interact to form acid rain.
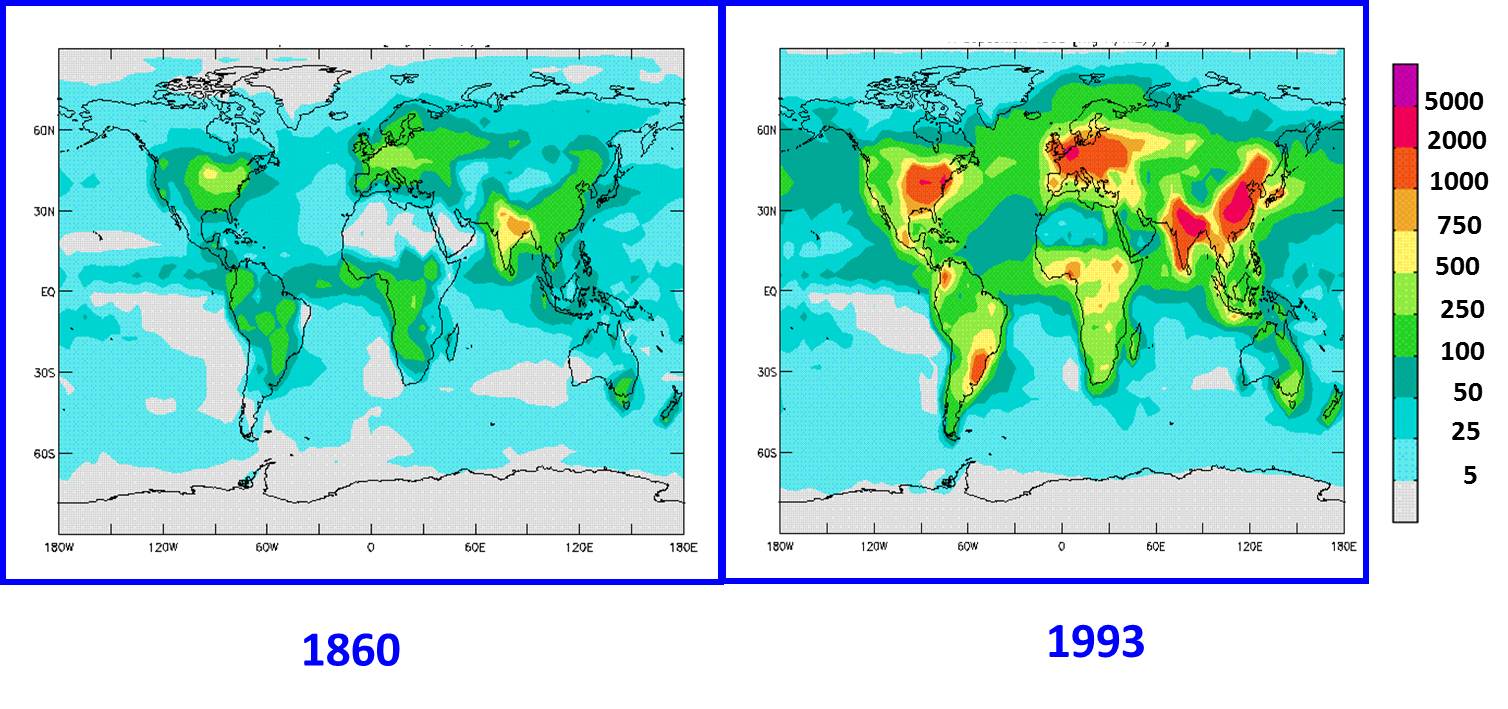
Figure 4. Nitrogen deposition worldwide has increased during the Industrial Period since 1860. Values in mg N/m2/year. From Galloway et al. 2002. |
One of the bi-products of nitrogen pollution into the atmosphere is that the deposition of nitrogen from acid rain has increased over time, as shown in Figure 4. This increase in nitrogen deposition worldwide is the key piece of information to help us answer the question raised in the Carbon Cycle lecture of whether we can decrease the amount of CO2 in the atmosphere and solve our global warming problem by planting more trees to take up CO2 from the atmosphere during photosynthesis. The CO2 removed from the atmosphere is then stored as organic carbon within the tree (leaves, wood, roots). However, as we learned in previous lectures, photosynthesis must be supported by inorganic nutrients such as nitrogen and phosphorus that limit overall plant growth. This inter-relationship between the carbon and nitrogen cycles in photosynthesis, and in regard to removing excess CO2 from the atmosphere, can be summarized in the following Figure 5. The basic question here is whether there is enough nitrogen available to support the growth of more trees, which would take-up CO2 from the atmosphere.
Figure 5. Ratios of C to N in vegetation (leaves), wood, and soils with respect to how much CO2 can be withdrawn from the atmosphere in photosynthesis given inorganic nitrogen supplied to the tree roots. |
Following along with Figure 5, we see that if the C taken up from the atmosphere in the form of CO2 during photosynthesis is stored in vegetation, then 1 N atom will allow the removal of 50 C atoms from the atmosphere (C:N ratio in the vegetation = 50). But to supply that 1 N atom the microbes must decompose organic matter in the soil, and with the soil organic matter having a C:N ratio of 25 it means that every 1 N atom produces 25 C atoms as CO2 during microbial respiration, which is then released back to the atmosphere. Therefore, we must account for that CO2 in our mass balance with respect to the atmosphere. As you can see in the Figure, with 1 N we remove 50 CO2s from the atmosphere in photosynthesis, but 25 CO2s are produced by respiration in the soils and returned to the atmosphere. The net effect then is 50-25 = 25 CO2s removed for every 1 N provided to the plant roots. The question then becomes where will the extra nitrogen come from to stimulate CO2 removal from the atmosphere? We know that most plants on Earth are often limited in growth by the availability of nitrogen, and planting new trees will make the needed nitrogen even more scarce. However, given the increase in nitrogen deposition over time from pollution, one might think that globally plants could have enough nitrogen and thus planting more trees would solve our problem of increased heat-trapping gases warming the climate.
Let's look more closely at that idea. The estimates of CO2 drawdown from the atmosphere based on increases in N depostion vary by about 2 billion tons of C (the same as the missing C sink), from 0.1 to 2.3 Pg/yr, and most of that variation is due to assumptions of where the C will be stored in the tree. For example, looking at Figure 5 we see that if the C is stored in wood with a C:N ratio of 200, then much more C can be stored (essentially 4 times more because 200/50 = 4) than if only the vegetation stores the C at a C:N ratio of 50. Therefore, we must understand where in the plant the C, or the N associated with the C in organic matter (CHON compounds), is being stored. In order to do this scientists performed experiments in Europe and the U.S. by adding the heavy isotope of nitrogen, 15N, to forests in order to trace where the 15N ended up in the plant. The results from these tracer studies, done in many different forest systems in the temperate zone, indicate that:
1. Most of the N deposition is stored in soils or lost in runoff. In other words, most nitrogen added doesn't even end up in the plant.
2. Less than 1/3rd of the N deposition is stored in trees, and only ~5% is stored in wood.
3. Increases in N deposition over time (found in acid rain or in general atmospheric pollution) do not appear to be slowing atmospheric CO2 increases, at either annual or decadal scales.
4. Although the N and C cycles are linked, adding more N to forests will not solve our CO2 problem.
The Mechanisms and Effects of Acid Rain
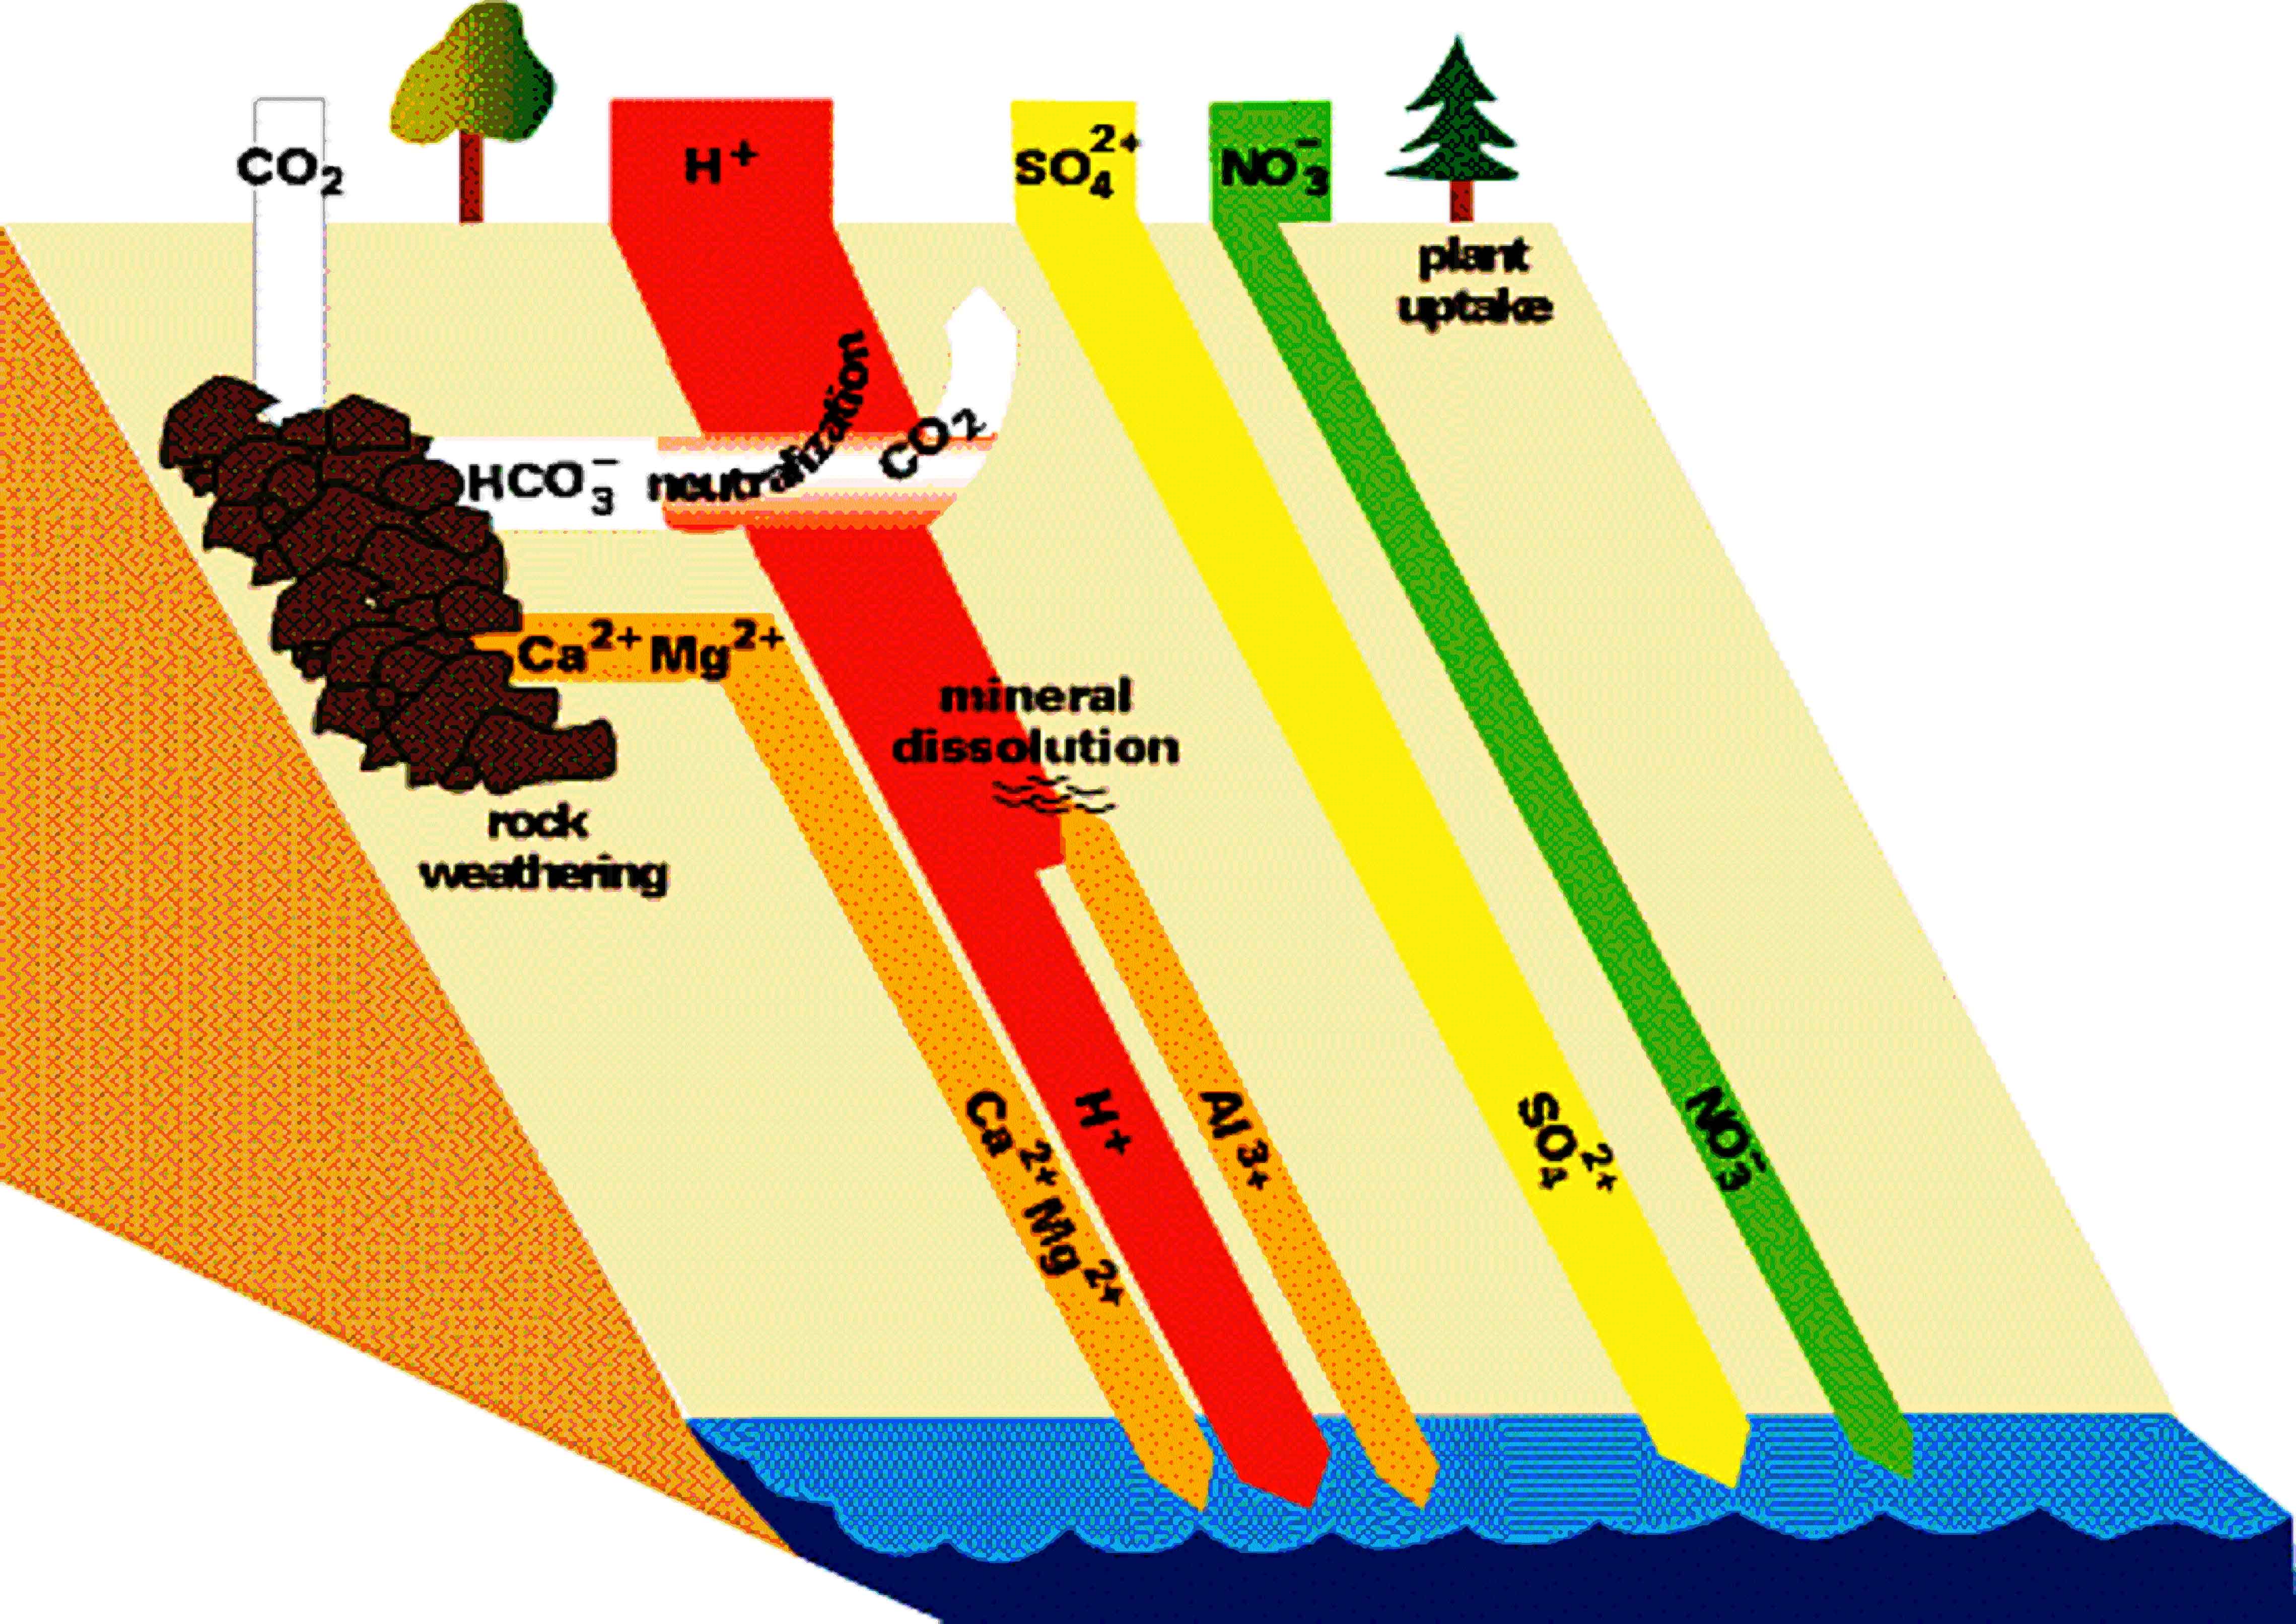
Figures 6 and 7 (below). Chemical reactions of acid rain components in soils.
 |
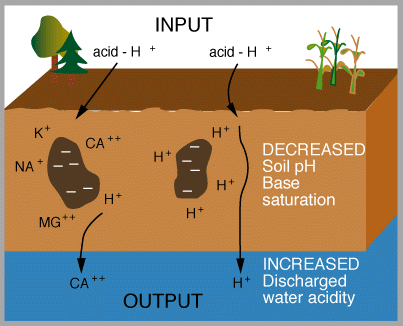 |
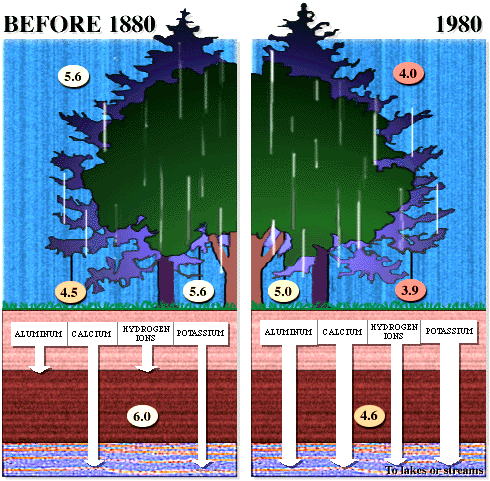
The important aspects of these figures can be summarized as follows: The buffering capacity of soils is limited by the amount of "base saturation" in the soils. Base saturation reflects the amount of base cations such as calcium and magnesium (positively charged) that are found attached to mineral grains in the soils. The higher the base saturation the more buffering capacity the soil has to adsorb H+ ions. H+ is neutralized by weathering reactions in the soil and in plants. H+ is a small ion that is very reactive - it has a large amount of charge (+1) for a very small radius, and thus it is able to "knock off" other, larger cations in the soil that are bound to the negatively charged mineral grains. Thus the acid is neutralized in the soil because the H+ that was added to top of the soil is retained on the negatively charged mineral grains and doesn't leave the soil. In turn, the base cations that were exchanged are washed out of the soil and into streams and lakes. Figure 8 below shows how the base saturation has changed in soils since industrial times.
What effects does acid rain have?
-
Plants, trees, and buildings can be damaged. Almost half of the Black Forest in Germany has been destroyed by acid rain.
-
As pH drops, aquatic life is negatively affected, especially molluscs and fish.
|
Figure
8. Diagram of the situation in a typical forest before acid
rain (~1880) and after acid rain |
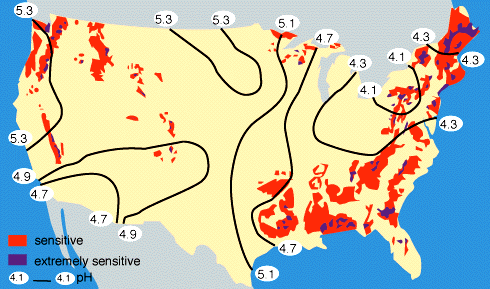
By measuring the buffering capacity of soils, you can determine regions of sensitivity to acid rain, as is shown in Figure 9 below.
|
Figure 9. Regions of sensitivity to acid rain in the United States. Also shown are the isopleths of the pH of precipitation; for example, all of the eastern U.S. currently has an average pH of rainfall between 4-5, where "neutral" rainwater has a pH of about 5.6. Rain with a pH less than 5.6 is considered to be "acid rain". |
Nitrogen Pollution and "Dead Zones" in Lakes and Oceans
Remember earlier we learned that most of the nitrogen pollution that is added to forests, or fertilizer added in agriculture, is NOT taken up by the soils or plants, but in fact it is lost from land in surface water runoff. That nitrogen in runoff then enters smalls streams that flow into larger rivers that flow into lakes and final to oceans. The same situation occurs with phosphorus, another important plant nutrient that is added in large-scale fertilization of cropland. Nitrogen and phosphorus are nutrients required by plants to grow, but, in excess they lead to runaway growth and in aquatic systems this growth forms large algal blooms.
These algal blooms are the first step in creating Dead Zones, but, they are also problems in their own right because they often contain noxious algae that produce toxic chemicals. In August of 2014, about 450,000 people in the city of Toledo had their water shut off because the toxic algae were polluting the city's water intake in Lake Erie. Nuisance algal blooms and dead zones created by excess nutrient runoff from land or from populated areas are now a common problem around the globe, especially in coastal areas as seen in Figure 10 below.

Figure 10. Global map showing the regions where dead zones in aquatic systems are persistent problems. Notice that most of the dead zones are located in regions of high population density, where runoff of nitrogen and phosphorus fertilizers are causing excess growth of algae in surface waters.
 |
 |
Figure 11. Maps showing (left) the Mississippi drainage basin and the hotspots of nutrient (nitrogen and phosphorus) runoff, and (right) the Gulf of Mexico algal bloom measured as the chlorophyll concentration in the water (red is higher chlorophyll) caused by the nutrient runoff.
But let's get back to the formation of dead zones themselves. As you learned in the Microbes lecture, all of this organic matter in the form of algal blooms dies and sinks to the bottom of the lake or ocean, where it is decomposed by microbes. The microbes consume oxygen in the decomposition process, because that is the electron acceptor that provides them with the most energy. Next, as you learned in the Blue Planet lecture and also in the Great Lakes Climate lecture, lakes and oceans stratify into layers with warmer, less dense water floating on top of colder, more dense water. This stratification means that once the layering has set up in the spring after ice-out, the bottom waters are isolated from the atmosphere and thus from a source of new oxygen. Therefore, the oxygen that is consumed by the microbes is not replaced, and the bottom waters go anoxic and stay that way until the lake mixes deeply again in the fall, before winter ice-up. It is this large volume of anoxic water that creates the "dead zone", because no fish or shrimp or any other animal can live there. (Of course bacteria can still live in anoxic water, they just use a different terminal electron acceptor, so these are not completely "dead" zones in a technical sense because the bacteria are still alive.) These dead zones can cause fish kills and limit the harvest of economically important fisheries, especially in the Gulf of Mexico. And as mentioned, the algal blooms themselves can produce toxins that can poison humans and other animals.
As you can see, this environmental problem is both widespread and difficult to manage. One component of a solution would be to limit the amount of nitrogen and phosphorus fertilizers that farmers can apply to only that amount which is used by the plant, and to limit application on fields during times when the plants are not growing (e.g., no applications in winter). A second component to a solution would be to reconstruct or restore the riparian zones and wetlands that surround both small and large streams and lakes. These zones are important locations where excess nutrient runoff from land is buffered, and the N and P can be taken up by riparian zone plants or the microbes can reduce the nitrate back to N2 gas and release it back to the atmosphere; this latter process of denitrification is often found to be strongest in riparian zones and wetlands.
Summary
-
The cycling of elements is a major aspect of how ecosystems function. Most of our major environmental problems of today involve perturbations of critical element cycles such as water, nitrogen, or carbon.
-
Increased N deposition from acid rain does not account for increased CO2 uptake in forests, and simply planting more trees cannot solve our global warming problem.
-
Acid rain is produced by the interactions of nitrogen and sulfur oxides that are put into the atmosphere from burning fossil fuels and industrial pollution, and the impacts of acid rain are controlled by many other element cycles on land and in the water.
-
Dead Zones are created by the excess runoff of N and P fertilizers, which stimulate algal blooms and lead to oxygen depletion in lakes and oceans.
-
The main take-home message for today's lecture is:
"ELEMENT CYCLES INTERACT AND CONTROL MANY ENVIRONMENTAL PROBLEMS -- they cannot be studied in isolation"
-
Review of main terms and concepts in this lecture.
All materials © the Regents of the University of Michigan unless noted otherwise.

