Human ecology
We wish to learn about:
• The changing ecological interactions of humans with other species from a historical perspective
• Interactions between early Homo and large mammalian predators
• Interactions between humans and corn (maize)
• The ecological footprint of modern human societies
Like all species, humans individually and as social groups participate in a variety of ecological interactions with other species in the ecosystems that they inhabit. Over human history, from the appearance of the earliest members of the human lineage to the present time, these interactions have changed substantially. We will examine three episodes in human history, with examples of predation, competition, and mutualism.
Episode I. Early Homo and mammalian predators
The fossil record of human evolution begins over 6 million years ago and documents a series of different species of early human in African fossil localities. The earliest members of the human lineage (Sahelanthropus, Ardipithecus from 4 to 7 million years old) had anatomical features of the skull, jaws, and body that were intermediate between those of our closest living relatives (common chimp and bonobo) and modern humans. Fossil limb elements and hip and shoulder girdles suggest that these early hominids were skilled at both climbing trees and walking on the ground bipedally. They had low, rounded, unspecialized molars, like those of older fossil apes from forest and woodland habitats; the diet is interpreted as plant-‐based omnivory—mainly fruits, leaves, eggs, and small animals. Later Australopithecus (several species from about 1.5 to 4.2 million years ago) had terrestrial patterns of locomotion and large teeth for their body size with very thick enamel. Their diets are interpreted as
consisting of tough plants from woodland to grassland habitats. These were the earliest human ancestors to live outside of forests in more open habitats. Species in our genus Homo (about 2.4 million years ago to the present time) lived alongside species of Australopithecus for about 1 million years. Species of Homo had larger brains and smaller teeth than in species of Australopithecus and all species of Homo, as well as some species of Australopithecus, show evidence of tool use in the form of worked stones. Fossil sites with stone tools and animal bones with cut marks indicate that early humans were using stone tools for processing carcasses of contemporaneous mammals, such as antelope, early horses, giraffes, hippos, and warthogs. The repeated associations of stone tools with animal bones in African fossil localities suggest that the tool makers were substantially increasing the amount of meat in their diets, compared to the diets of their predecessors. This change in dietary habits would have brought these early humans into competition with contemporaneous mammalian carnivores, such as large cats and hyenas, over mammal carcasses.
All animals are predators in the broadest ecological sense, since animals must consume other organisms as food. Early humans were not unusual in consuming fruits, leaves, and small animals; in fact, such omnivorous habits are characteristic of many primates. For most of
their fossil history, early humans were relatively rare members of their ecosystems, compared to more abundant species of antelope, early horses, bush pigs, and hares. Early species of Homo started to become unusual mammals in several respects. The size of their teeth diminished as tools became more prevalent, and brain volume increased. The geographic range of Homo expanded considerably, eventually stretching over much of Africa and Eurasia, whereas all previous hominid species inhabited regions within Africa. Also, several lineages of mammalian carnivores became extinct as tool use became more prevalent. This coincidence led two mammal paleontologists, Margaret Lewis and Lars Werdelin, to propose the hypothesis that competition between early Homo and several large carnivores over prey species or carcasses caused the extinction of these carnivores.
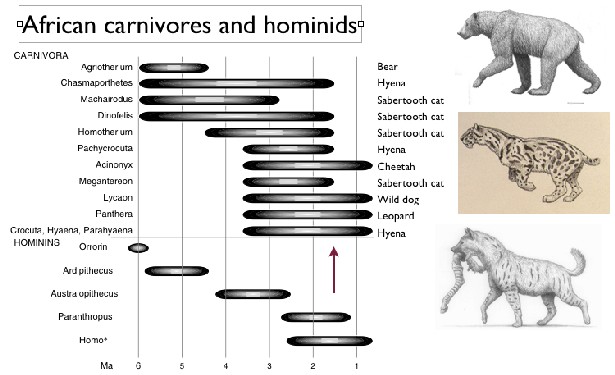
The figure below shows the distribution through geologic time of 11 species of large mammalian carnivores and five hominid lineages from the East African fossil record (figure from Treves and Palmqvist 2007). The common name of each mammalian carnivore is given on the right of the graph and three species (at top right the bear, Agrotherium; center right the saber-‐tooth cat Megantereon; lower right the hyena Pachycrocuta) are illustrated
(illustrations by Mauricio Anton). The co-‐occurrence of these carnivores with early hominids in the same ecosystem is implied by fossil remains of both kinds in the same fossil localities. Several of these carnivores were considered ambush predators and early hominids could have been prey to these carnivores as happens on an infrequent basis today.
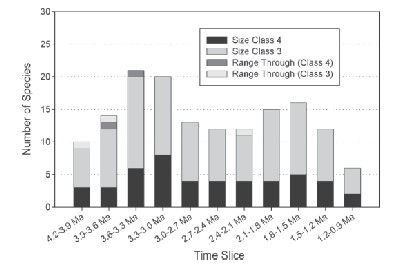
Lewis and Werdelin compiled data about the diversity of large mammalian carnivores over the time period when these carnivores occupied the same ecosystems as early hominids did. They found a remarkably high species diversity of large-‐bodied carnivore species from 4.2 to 1.2 million years ago (see figure, from Lewis and Werdelin 2007). Their size class 3 includes carnivores with adult body weights of 21.5 to 100 kg; modern species in this size class include the cheetah and wild dog. Their size class 4 includes carnivores with adult body weights greater than 100 kg; the only modern species in this size class in Africa is the lion. Notably, there were more species in both size classes in the past than occur today in any modern ecosystems. There were two peaks in diversity of these large carnivores, one between 3.0 and 3.6 million years ago, and a smaller peak between 1.5 and 2.1 million years ago. Both this figure and the one above show that large carnivores experienced a substantial decline, starting around 1.8 million years ago (arrow in figure above). Between then and 0.9 million years ago, 10 species of large carnivores became extinct.
Lewis and Werdelin propose the following scenario for the interactions of early hominids and large carnivores (see figure below from Lewis and Werdelin 2007). Prior to about 1.8 million years ago, large mammalian carnivores and early humans coexisted in African ecosystems without mutually adverse impacts. Hominins (early humans) were most likely prey to some of the large predators before the advent of stone tools and changing human dietary behavior. Lewis and Werdelin attribute the substantial decline in diversity of large carnivores beginning at 1.8 million years ago to the combined effects of cooling climate and appearance of the hominid Homo ergaster. As hominids incorporated mammal meat in their diets, they needed effective behavioral strategies to defend or even steal carcasses. Homo would have competed with large mammalian carnivores either as a scavenger (stealing carcasses) or as a hunter of prey animals that reduced the amount of prey available to the large carnivores. The pattern of decline in large carnivores supports the hypothesis of increasing competition between early Homo as an important factor in the extinction of the carnivores. In modern African ecosystems, there is still a high diversity of small-‐bodied carnivores (mongooses, civets, jackals) but few large carnivore species. All of these ecosystems have a strong human presence along with various domestic species.
This hypothesis of competition between early humans and large mammalian carnivores can be further tested by evaluating whether population size of large carnivores declined as early human populations increased and whether similar patterns of human arrival in ecosystems in other regions of the world were followed by decline in the species of large mammalian carnivores. This example illustrates the effects of human populations as competitors with other species over food resources.
Episode II. Humans and corn
The second example also involves human interactions over food, this time with the domesticated grass species Zea mays, familiar to us as corn. From humble origins as a wild species, domestic corn has become one of the world’s most successful plants. In the spring of
2012, U.S. farmers planted 97 million acres in corn—far more land than for any other U.S. crop. Americans consume corn directly as food; in addition, almost 15,000 items at the typical American supermarket contain products made from corn—including cornmeal, cornstarch, corn sweeteners, and corn in packaging. Globally, more tons of corn are produced today than of any other crop.
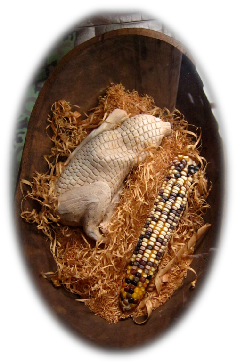
Corn was domesticated from a wild grass in southern Mexico, at least 9,000 years ago. Archeologists have recently described milling and grinding stones along with remains of domestic corn and squash from a rock shelter in the state of Guerrero (see the figure below for the rock shelter on the left and the grinding stones on the right, from Ranere et al. 2009). These remains in Guerrero occur within the present distribution of the wild ancestor of corn, called teosinte. Remarkably, corn cobs and pollen in archeological sites indicate that corn quickly spread from its area of origin to Panama by 7600 and to northern south America by 6000 years ago.
[At left: corn art in southern Mexico today, C. Badgley.]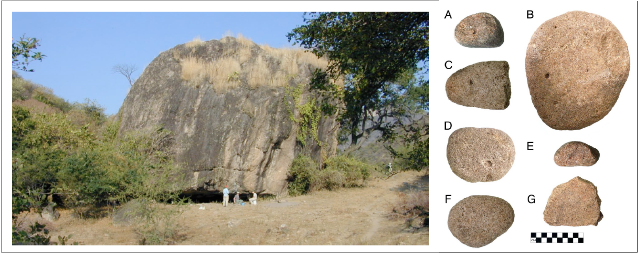
Mexico remains the center of diversity of corn varieties with many unique varieties adapted to different highland and lowland cultures, and corn is the staple food for most Mexicans. Today, corn varieties are grown nearly worldwide (see map below), and corn has become an important staple in other regions of the world, including East Africa and the United States. While its primary use is still for human food, about 30% of the world’s corn (and almost 70% of corn grown in the U.S.) is fed to livestock. In the last ten years, an increasing share of U.S. corn is grown for ethanol fuel production. Corn is also an ingredient in adhesives, tires, paint, wallboard, joint compound, emulsifiers, and whiskey.
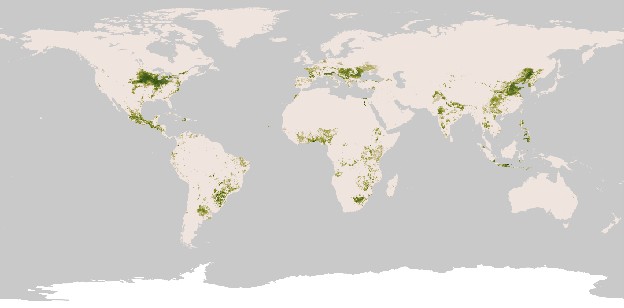
Regions of the world where corn is a dominant crop today. Image credit: NASA Earth Observatory, http://eoimages.gsfc.nasa.gov/images/imagerecords/47000/47250/global_maize_2000_geo.tif
In addition to agricultural land area, considerable industrial resources are devoted to corn at this point in time. More than half of the synthetic nitrogen fixed for fertilizer is applied to corn fields worldwide. A considerable quantity of herbicides to control weeds and insecticides to control insect pests is applied to corn fields. These synthetic inputs have widespread side effects. For example, atrazine, an herbicide widely used on corn in the United States, is present in groundwater and therefore drinking-water sources, over most of the corn belt in the Midwestern United States. Fertilizer runoff into streams and rivers throughout the upper Mississippi River catchment area, which drains the northern corn belt, is largely responsible for the “dead zone” in the Gulf of Mexico, a region where the high nutrient load has caused algal blooms that enrich the water column with organic matter. An overload of decaying organic matter leads to depletion of oxygen as microbial decomposers proliferate, causing large volumes of water to become anoxic.
The success of corn in terms of the amount of land and resources devoted to its growth, processing, and consumption represents a remarkable example of mutualism between corn and humans. Humans receive food, livestock feed, fuel, and a variety of products made from corn. In turn, humans devote substantial resources to growing corn, have vastly expanded the geographic range of this plant compared to that of its wild ancestor, and have displaced many native species in the process of establishing corn in ecosystems around the world. The mutual dependence of humans and corn for 9000 years illustrates that human impacts on their ecosystems occurs not just through predation and competition but also through mutualism.
Episode III. The ecological footprint of human societies in the 21st century
The ecological footprint (EF) is a composite measure of human impacts on the biosphere. The EF attempts to measure resources consumed or the amount of land area required to absorb wastes generated by human activities. All the different resources and activities of individuals, products, or societies are converted into the ecologically productive land area needed to provide these resources, given prevailing technologies and resource management. In parallel with assessing the EF, this approach also entails measurement of the biocapacity of regions, countries or the entire world. Biocapacity is the amount of land area available to provide resources and absorb wastes. First introduced in 1996, the EF concept and metrics have been adopted by a wide range of government agencies and sustainability organizations.
The EF is calculated in terms of annual demand in relation to annual yield of a particular resource. For example, the EF of food consumption can be expressed in terms of the amount of kilograms of food consumed in relation to the yields of the different food items in kilograms per hectare. If the formula is kg consumed/kg produced per unit area, then the EF units reduce to area required to produce the food consumed. In terms of ecological interactions, the EF encompasses predation (e.g., food consumption), competition (e.g., displacing native habitats by cities, cropland, and roads), and mutualisms (e.g., favoring the spread of some plants and animals for mutual benefit).
When EF calculations are used to compare the EF of different regions, then the formula also entails two factors that allow units of land area to be compared around the world. The EF formula for global hectares is: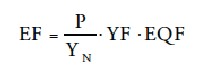
P is the amount of a product harvested, YN is the national average yield for that product, YF or yield factor is the ratio of the national average yield to the global average yield for that product, and EQF or the equivalence factor converts the area required for generating a particular product into the area of biologically productive land on a global basis.![]()
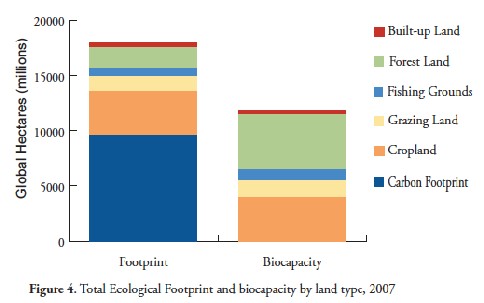
Biocapacity is calculated as the amount of land area available for producing one or more resources, adjusted by yield and equivalence factors. The Ecological Footprint Atlas (2010) provides further details for these calculations. One interesting use of the EF metric is calculating the EF of individuals, as you have done in one of your labs. This exercise illustrates how demanding different aspects of each person’s lifestyle are, and provides a way of comparing the resource demands of people with different lifestyle choices. Another use of the EF metric is to evaluate the overall impact of the current human population on the biocapacity of the earth. In 2007, the most recent comprehensive assessment, the total EF of human societies was 18.0 billion “global hectares” of biologically productive land (one hectare is the equivalent of about 2.5 acres), whereas the total biocapacity of the earth was 11.9 billion global hectares. This comparison is illustrated below (from the Ecological Footprint Atlas 2010). It carries the sobering message that human societies have a greater resource demand than the earth can currently provide. The only way that this can occur is for the biocapacity to be degraded for future uses.
Another interesting use of the EF metric is to compare the average EF per capita of different countries. The figures below illustrate the average EF of consumption for 153 countries. (The total EF includes the EF of consumption and production.) The different colors in the columns correspond to the same colors in the figure above, and show how different resources contribute to the average per-‐capita EF of different countries. Note how much the carbon footprint varies among countries with large versus small EFs. These graphs invite a number of comparisons. What is the explanation for the two countries with the highest per-capita EF? For how many countries depicted does the per-capita EF match the estimate of global biocapacity (the dashed horizontal line)?
The Ecological Footprints of Nations: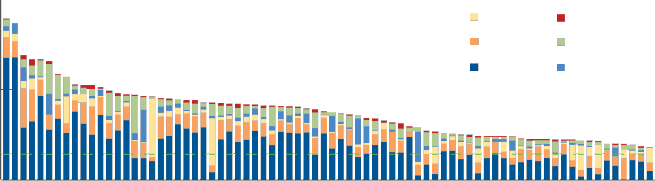
![]()
![]()
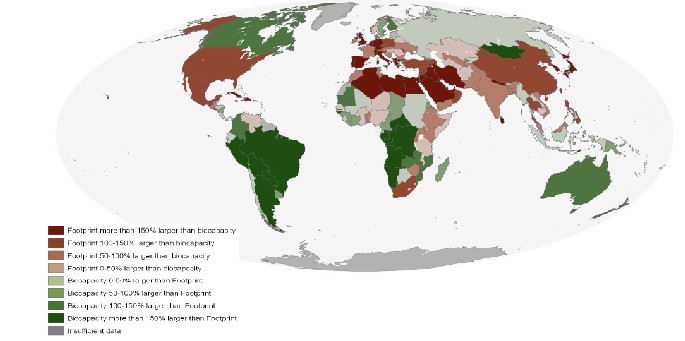
Finally, for which countries does the EF exceed the biocapacity of that country? This question allows us to compare creditor and debtor countries in terms of national EF versus national biocapacity. The map below illustrates which countries are which. For the countries colored dark red (those with the largest EF debt), which have this status because of their consumption habits and which have this status because of the low natural biocapacity of the region? How do debtor countries persist in their resource uses?
In summary, these three cases illustrate the wide variety of ecological interactions that human societies engage in, now and in the recent as well as distant past. There are also many ecological interactions involving humans and other species that have little impact on local ecosystems. It is noteworthy that even at low levels of technology and resource consumption, the long-‐term impacts on species and ecosystems can be substantial.
Recommended reading and sources cited:
Global Footprint Network 2010, The Ecological Footprint Atlas 2010. Oakland, California. See http://www.footprintnetwork.org.
Lewis, M.E. and L. Werdelin. 2007. Patterns of change in the Plio-‐Pleistocene carnivorans of East Africa: implications for hominin evolution. Pp. 77-‐105 in R. Bobe, Z. Alemseged, and A.K. Behrensmeyer, editors, Hominin environments in the East African Pliocene: An Assessment of the Faunal Evidence. Springer, New York.
Ranere, A.J., D.R. Piperno, I. Holst, R. Dickau, and J. Iriarte. 2009. The cultural and chronological context of early Holocene maize and squash domestication in the Central Balsas River Valley, Mexico. Proceedings of the U.S. National Academy of Sciences vol.
106: 5014-‐5018.
Treves, A. and P. Palmqvist. 2007. Reconstructing hominin interactions with mammalian carnviores (6.0-‐1.8 Ma). Pp. 355-‐381 in K.A.I. Nekaris and S.L. Gursky, editors, Primate Anti-‐predator Strategies. Springer, New York.
10