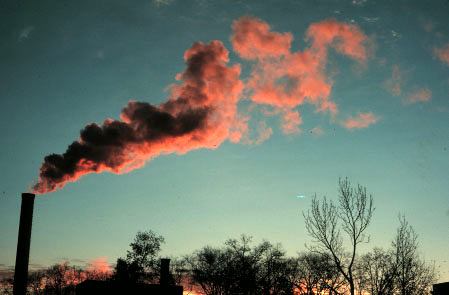
Dust in the Wind
"Therefore, O Painter, make your smaller figures merely
indicated and not highly finished, otherwise you will produce effects
opposite to nature, your supreme guide. The object is small by reason
of the great distance between it and the eye; this great distance is
filled with air, that mass of air forms a dense body which intervenes
and prevents the eye from seeing the minute details of the objects".
Leonardo da Vinci, "Six Books on Light and Shade."
Suggested Readings:
- An Introduction to Visibility, A guide to visibility (3.1mb Adobe PDF format).National Park Service.
- Protecting Visibility in National Parks and Wilderness Areas (1993), National Academy of Science Report
- Airborne Minerals and Related Aerosol Particles: Effects on Climate and Environment , (1999), National Academy of Science.
- White, J. C., "Global Climate Change Linkages: Acid Rain, Air Quality, and Stratospheric Ozone", Elsevier, 1989.
We wish to learn:
- What can natural and anthropogenic aerosols impact global, regional
and local temperatures?
- How might clearing the air of particles produce other environmental
changes?
- How has haze changed our atmospheric environment over the past century?
- What the heck is in this stuff we're breathing?
| Introduction
To Global Change I - Lecture Notes |
|
|||
| How Fresh is Your Air? | The Nature of Aerosols | Sources of Aerosols |
Impacts | Summary |
1. How "Fresh" is Your Air?
How much do we share air? An old problem that addresses this is "Do we breath air Caesar breathed?" Or, stated in a way that we can calculate: "Will your next breath will include atoms that Caesar once breathed?"
Let's solve a simpler problem that seems even more unlikely to give a yes answer: "Will your next breath will include atoms from Caesar's last breath?" This is simpler, because we don't need to estimate the total amount Caesar breathed. We will assume that his last breath was the same size as each of ours.
Of course, we don't really care about Caesar's atoms that much or his last breath, but the point is that if we share his air, we share everyone's.
So let's solve the problem:
Caesar lived long enough ago that we can assume any atoms he once breathed are uniformly distributed throughout the atmosphere. Let's calculate how many atoms he breathed in his last breath and how diluted those are in the atmosphere.
Here is some interesting data we will need:
- A mole of any gas occupies 22.4 liters and contains about 6x10²³ atoms.
- The atmosphere contains about 2x10²⁰ moles of gas.
- Each breath we take contains about one liter of gas.
[Source: "Consider a Spherical Cow" by John Harte (1988, University Science Books, Sausalito, CA). This is a great book for this kind of calculation.]
First, let's get rid of that "one liter" and convert it to moles. How many moles are in each breath? Since we breathe about a liter, it is the same as the number of molecules in a liter. This is about: (6x10²³ molecules per mole)/(22.4 liters per mole) ~ (1/4)x1023 molecules = 2.5x10²² molecules per liter). We will assume that Caesar's last breath as well as any one of ours contains the same 2.5x10²² molecules.
Our second step is to estimate how many molecules are there in the entire atmosphere? It is: (2x10²⁰ moles)*(6x10²³ molecules per mole) = 12x1043 molecules or 1.2x1044 molecules in the air.
So, if the molecules from Caesar's last breath were uniformly distributed, there are the following number of air molecules per "Caesar molecule": (1.2x1044 molecules in the air)/(2.5x1022 molecules in a Caesar breath) ~ (1/2)x1022 air molecules per Caesar molecule. This is the same as 5x10²¹ air molecules per Caesar molecule. In other words, if you breathed 5x10²¹ air molecules it is likely that you would breathe a Caesar molecule.
How many molecules do you breathe each breath? We already know that we breathe 2.5x10²² molecules per breath. This is more than the 5x10²¹ air molecules that are likely to contain one Caesar molecule. In fact, you are likely to breathe 2.5x10²² /5x1021 = 5 of the molecules in Caesar's last breath each breath we take!
The Solution to Pollution is Dilution
Resources:
|
In the previous example it was assumed that the air exhausted by Caesar must be evenly distributed through all the air of the atmosphere by now. What would be a realistic estimation if we were interested in estimating the number of molecules in our lungs from, say, an upwind incinerator or the tailpipes on I-94?
To solve these questions we must make assumptions about the rate at which pollutants disperse once emitted into the environment. The factor affecting the rate of dispersion is atmospheric stability, which is a measure of how easily the atmosphere can be mixed vertically. The ground concentration then depends upon the height of emission, the temperature of the emission (to determine how high it will rise above the top of the stack), the wind speed (at low winds the air is mixed less but can rise higher away from the source, at high wind speeds the plume is better mixed but kept closer to the ground), the distance from the source, and other factors.
The importance of stack height on ground concentrations was recognized over 50m years ago and led to the engineering solution that "The Solution to Pollution is Dilution." That is, the same emission rate from a tall stack will have far less impact on the nearby recipients. Unfortunately, this approach to lowering human exposure ignored the potential impacts of those emissions on areas further downwind. Hence the quick and easy solution, while effective, produced unforeseen environmental impacts.
2. The Nature of Particulate Matter
Definition:Aerosol: small droplet or particle suspended in the atmosphere, typically containing sulfur Aerosols are emitted naturally (e.g., in volcanic eruptions) and as the result of human activities (e.g., by burning fossil fuels). There is no connection between particulate aerosols and pressurized products also called aerosols |
The term "particulate matter" (PM) includes both solid particles and liquid droplets found in air. The term is used interchangeably with "aerosols" in much of the scientific literature (see definition to right). Many manmade and natural sources emit PM directly or emit other pollutants that react in the atmosphere to form PM. These solid and liquid particles come in a wide range of sizes. Particles less than 10 micrometers in diameter tend to pose the greatest health concern because they can be inhaled into and accumulate in the respiratory system. Particles less than 2.5 micrometers in diameter are referred to as "fine" particles. Sources of fine particles include all types of combustion (motor vehicles, power plants, wood burning, etc.) and some industrial processes. Particles with diameters between 2.5 and 10 micrometers are referred to as "coarse." Sources of coarse particles include crushing or grinding operations, and dust from paved or unpaved roads.
Size Distribution
Aerosol can either be produced by ejection into the atmosphere, or by physical and chemical processes within the atmosphere (called primary and secondary aerosol production respectively). Examples of primary aerosol are sea spray and wind blown dust. Secondary aerosol are often produced by atmospheric gases reacting and condensing, or by cooling vapor condensation (gas to particle conversion). Figure 1 shows some of these processes, along with the three size ranges (modes) where high aerosol concentrations are often observed.
 |
Figure 1. The three ranges for atmospheric particles and the processes leading to their formation. |
Impact on Energy Redistribution
The study of aerosol is interesting for a number of reasons. It is thought that aerosol may be involved in a feedback to global warming.
Particles could act to cool the atmosphere in direct and indirect ways. A direct effect is that the increased particles act to reflect incident solar radiation back into space. The magnitude of the direct effect is simpler to estimate than that of the indirect effect . æ The indirect effect again involves increased average aerosol number concentration. An increased aerosol population means that there are more cloud condensation nuclei, which would lead to more clouds forming. This situation is slightly more complicated, as the effect of the clouds on the EarthÍs radiation budget depends upon the cloud height, but increased tropospheric aerosol would also have a cooling effect on the atmosphere. æ
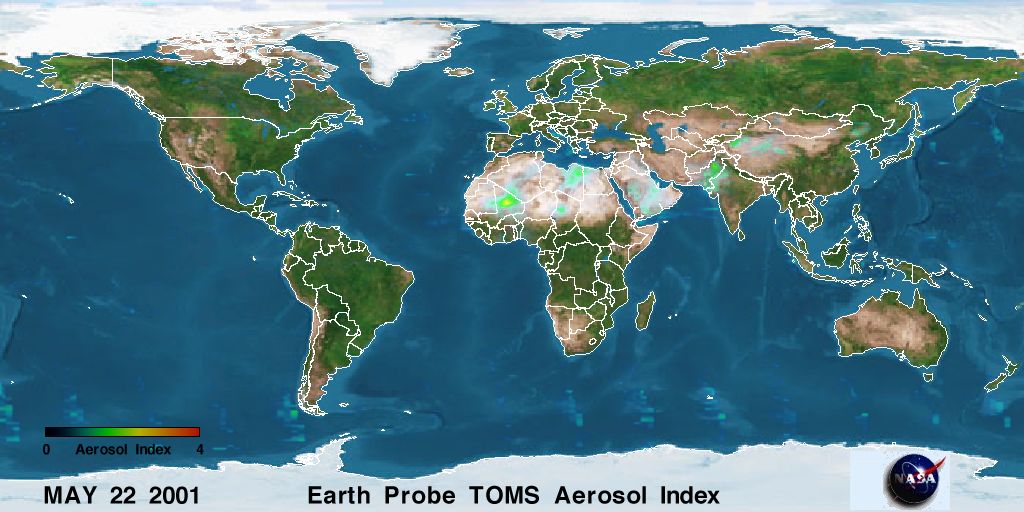 |
| Figure 2a. Current image of global aerosol density. Click image for larger view. [Source: NASA] |
Anthropogenic aerosols tend to produce negative radiative forcings:
- Tropospheric aerosols (microscopic airborne particles) resulting from
combustion of fossil fuels, biomass burning and other sources have led
to a negative direct forcing of about 0.5 Wm-2, as a global average,
and possibly also to a negative indirect forcing of a similar magnitude.
While the negative forcing is focused in particular regions and subcontinental
areas, it can have continental to hemispheric scale effects on climate
patterns.
- Locally, the aerosol forcing can be large enough to more than offset
the positive forcing due to greenhouse gases.
- In contrast to the long-lived greenhouse gases, anthropogenic aerosols
are very short-lived in the atmosphere, hence their radiative forcing
adjusts rapidly to increases or decreases in emissions.
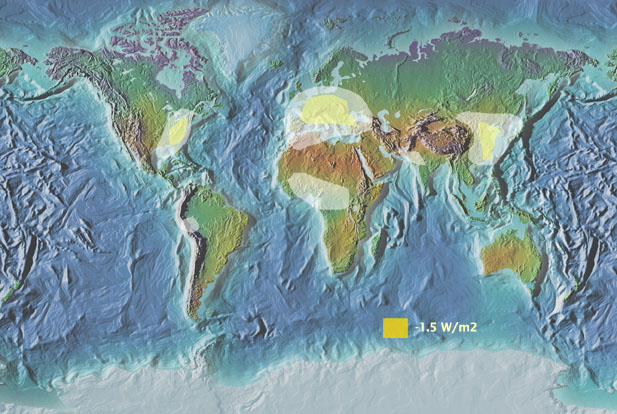
Figure 2b. Estimated regions where cooling is happening due to aerosol loading from anthropogenic sources.
3. Sources of Aerosols
Particulate matter (PM) is the general term used for a mixture of solid particles and liquid droplets found in the air. Some particles are large or dark enough to be seen as soot or smoke. Others are so small they can be detected only with an electron microscope. These particles, which come in a wide range of sizes ("fine" particles are less than 2.5 micrometers in diameter and coarser-size particles are larger than 2.5 micrometers), originate from many different stationary and mobile sources as well as from natural sources. Fine particles (PM2.5) result from fuel combustion from motor vehicles, power generation, and industrial facilities, as well as from residential fireplaces and wood stoves. Coarse particles (PM-10) are generally emitted from sources, such as vehicles traveling on unpaved roads, materials handling, and crushing and grinding operations, as well as windblown dust. Some particles are emitted directly from their sources, such as smokestacks and cars. In other cases, gases such as sulfur oxide and SO2, NOx, and VOC interact with other compounds in the air to form fine particles. Their chemical and physical compositions vary depending on location, time of year, and weather.
Natural Sources
Natural sources of aerosols include dust / sea salt / marine sulfate compounds, and volcanic emissions. The first group has remained roughly constant for at least a century, so they aren't changing climate as we know it. Volcanic emissions are sudden and significant. Following large eruptions, global temperatures have dropped, but only for a few years, because in time the particles get rained out of the atmosphere.
Anthropogenic Sources
Anthropogenic sources of aerosols come from industrial societies. Automobiles and more importantly, industries, emit sulfur dioxide, which is changed into sulfate haze. We know the amount of sulfur dioxide in the atmosphere is increasing, causing such destructive phenomena as acid rain. So the bottom line is that natural sources of aerosols are not causing overall global cooling. If this global cooling effect is real, it is of man-made origin.
4. Impacts
 |
| Figure 3. The above real-time measurements are obtained using Tapered
Element Oscillating Microbalance air monitors
(TEOMs) which determine the concencentrations of PM2.5
on an hourly basis. The map above shows the daily PM2.5
average levels. The currently operational sites shown above are: Grand
Rapids; Lansing; Ypsilanti and Saginaw. Coming soon: Allen Park in
Detroit; Kalamazoo and Flint.
Figure 4. Between 1988 and 1997, average PM-10 concentrations decreased 26 percent. Short-term trends between 1996 and 1997 showed a decrease of 1 percent in monitored PM-10 concentration levels. |
The concentrations of particulates in the atmosphere are monitored routinely to evaluate potential health risks. In general the trends in particulate matter concentrations have been toward lower values (see Figure 4)
Health Issues
Both fine and coarse particles can accumulate in the respiratory system and are associated with numerous health effects. Coarse particles can aggravate respiratory conditions such as asthma. Exposure to fine particles is associated with several serious health effects, including premature death. Adverse health effects have been associated with exposures to PM over both short periods (such as a day) and longer periods (a year or more).
- When exposed to PM, people with existing heart or lung diseases?such
as asthma, chronic obstructive pulmonary disease, congestive heart disease,
or ischemic heart disease?are at increased risk of premature death or
admission to hospitals or emergency rooms.
- The elderly also are sensitive to PM exposure. They are at increased
risk of admission to hospitals or emergency rooms and premature death
from heart or lung diseases.
- When exposed to PM, children and people with existing lung disease
may not be able to breathe as deeply or vigorously as they normally
would, and they may experience symptoms such as coughing and shortness
of breath.
- PM can increase susceptibility to respiratory infections and can aggravate existing respiratory diseases, such as asthma and chronic bronchitis, causing more use of medication and more doctor visits.
| Air Quality Index (AQI): Particulate Matter (PM) | |||
|---|---|---|---|
| Index Values |
Levels of Health Concern |
Cautionary Statements* | |
| PM2.5 | PM10 | ||
| 0 - 50 | Good | None | None |
| 51 - 100** | Moderate | None | None |
| 101 - 150 | Unhealthy for Sensitive Groups | People with respiratory or heart disease, the elderly, and children should limit prolonged exertion. | People with respiratory disease, such as asthma, should limit outdoor exertion. |
| 151 - 200 | Unhealthy | People with respiratory or heart disease, the elderly, and children should avoid prolonged exertion; everyone else should limit prolonged exertion. | People with respiratory disease, such as asthma, should avoid outdoor exertion; everyone else, especially the elderly and children, should limit prolonged outdoor exertion. |
| 201 - 300 | Very Unhealthy | People with respiratory or heart disease, the elderly, and children should avoid any outdoor activity; everyone else should avoid prolonged exertion. | People with respiratory disease, such as asthma, should avoid any outdoor activity; everyone else, especially the elderly and children, should limit outdoor exertion. |
| 301 - 500 | Hazardous | Everyone should avoid any outdoor exertion; people with respiratory or heart disease, the elderly, and children should remain indoors. | Everyone should avoid any outdoor exertion; people with respiratory disease, such as asthma, should remain indoors. |
| * | PM has two sets of cautionary statements, which correspond
to the two sizes of PM that are measured:
|
||
| ** |
|
||
| Revised Particulate Matter Standards: In 1997, EPA added two new PM2.5 standards, set at 15 micrograms per cubic meter (µg/m3) and 65 µg/m3, respectively, for the annual and 24-hour standards. In addition, the form of the 24-hour standard for PM10 was changed. EPA is beginning to collect data on PM2.5 concentrations. Beginning in 2002, based on 3 years of monitor data, EPA will designate areas as nonattainment that do not meet the new PM2.5 standards. |
Visibility
|
Great Smoky Mountains
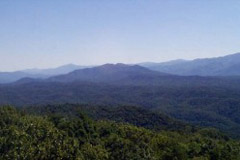 Clear Day
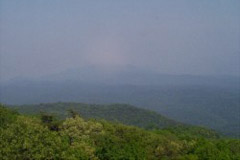 Hazy Day
More real-time imagesAcadia National Park, Bar Harbor, Maine - Camera near air quality station Canyonlands National Park, Utah - At visitor center next to monitoring site Yosemite National Park, California - View from air quality site on Turtleback Dome For more information on visibility read Introduction to Visibility A beginners guide to visibility. |

One of the most basic forms of air pollution -- haze -- degrades the visibility in many of America's cities and scenic areas. Haze obscures the clarity, color, texture and form of what we see.
Haze is caused when light encounters tiny pollution particles (sulfates, nitrates, organic carbon, soot, and soil dust) and some gases (nitrogen dioxide) in the air. Some light is absorbed by the particles and gases and other light is scattered away before it reaches an observer. More pollutants mean more absorption and scattering of light, resulting in more haze. Humidity (especially prevalent in the East) magnifies the haze problem, because some particles, such as sulfates, attract water and grow in size, scattering light better than other particles. Some haze-causing pollutants are formed when gases emitted to the air form particles as they are carried many miles from the source of the pollutants. Particles that are formed from gases include sulfates, nitrates, and some organic carbon particles. Other haze-causing pollutants (mostly small particles) are directly emitted to the atmosphere from sources such as electric utilities and industrial fuel burning, manufacturing processes, and vehicle emissions. Natural sources such as forest fires and windblown dust also contribute to haze.
Visibility is generally worse in the East than in the West. In the eastern United States, reduced visibility is primarily caused by sulfates from power plants and other large, industrial sources. Emissions from these same types of large, industrial sources also account for much of the visibility impairment in the West. However, other sources (such as woodsmoke from burning or nitrates from auto emissions) play a more significant role in the West than in the East. Visibility varies with the season and is generally worse during the humid summer months. In our nation's scenic areas, the visual range has been substantially reduced. In eastern parks, average visual range has decreased from 90 miles to 15-25 miles. In the West, visual range has decreased from 140 miles to 35-90 miles.
Our ability to define, monitor, model and control anthropogenic visibility impairment is dependent on understanding of the scientific and technical factors that affect atmospheric visibility. Visibility involves an observerÍs perception of the physical environment. The fundamental factors that determine visibility include:
- Illumination of the scene by the sun, as mediated by clouds, ground
reflection, and the atmosphere;
- Reflection, absorption, and scattering of incoming light by the target
objects and sky resulting in inherent contrast and color patterns at
the target location;
- Scattering and absorption of light from the target and illumination
source by the atmosphere and its contaminants;
- Psychophysical response of the human eye-brain system to the resulting
light distribution, and
- Subjective judgment of the perceived images by the observer.
The air pollution related alteration of the appearance of distant objects (reduction in apparent contrast and visual range) can be estimated if the extinction coefficient, bext, is known. The extinction coefficient represents a summation of the air and pollutant scattering and absorption interactions:
bext = bRg + bag + bscat + bap
Where:
bRg is Rayleigh scattering by air molecules;
bag is absorption by NO2 gas;
bscat is scattering by particles;
bap is absorption by particles;
The units of extinction are inverse distance, e.g., 1/mile. The most commonly used units are km-1 and (10-4m-1). As extinction increases, visibility decreases.
Rayleigh Scatter (bRg)
The particle-free molecular atmosphere at sea level has an extinction coefficient of about 0.012 inverse kilometers (km-1) , limiting visual range to about 320 km. bRg decreases with air density and altitude. In some remote western areas, the optical extinction of the atmosphere is at times essentially that of the particle-free atmosphere. Rayleigh scatter thus amounts to a simply definable and measurable background level of extinction against which other extinction components (such as those caused by man-made pollutants) can be compared. Rayleigh scattering decreases with the fourth power of wavelength (i.e.blue light scatters more than red light) and contributes a strongly wavelength-dependent component to extinction. When Rayleigh scattering dominates, dark objects viewed at distances of over several kilometers appear behind a blue haze of scattered light, and bright objects on the horizon (such as snow, clouds, or the sun) appear reddened at distances greater than about 30 km.
Absorption by Nitrogen Dioxide Gas (bag)
Of all gaseous air pollutants, only nitrogen dioxide (NO2) possesses a significant absorption band in the visible part of the spectrum. Nitrogen dioxide and its precursor, nitric oxide (NO), are emitted by high temperature processes such as combustion in fossil-fuel power plants. Nitrogen dioxide is strongly blue-absorbing and can color plumes red, brown, or yellow. The hue and intensity of color depend on concentration, optical path length, aerosol properties, conditions of illumination, and observer parameters. In non-urban settings, the area-wide concentration of NO2 is less important than the levels in coherent plumes. The absorption coefficient drops off rapidly with wavelengths which can give a brownish color when viewed against a white background. However, at concentrations more typical of non-urban areas, (less than 0.01 ppm) area-wide impacts of NO2 absorption are unimportant.
Particle Scattering (bscat) and Absorption (bap)
As the particle concentration increases from very low levels where Rayleigh scatter dominates, the particle scattering coefficient bscat increases until eventually bscat > bRg. At this point, the visual quality of air is controlled by particle scattering. In understanding the degradation of visual quality of air two principal problems have been:
- Defining the size range and other physical characteristics of particles most effective in causing scatter and
- Defining the chemical composition and, thus, identifying the source of particles in this optically effective size range.
5. Summary
- Good news: The concentration of atmospheric particles seems to be
dropping in the United States. This improves the quality of the air
we breathe and may also improve visibility slightly.
- Bad news: The same industries and automobiles which are emitting carbon
dioxide are also creating particles. This cools the Earth by blocking
incoming radiation. So the temperature increase expected from greenhouse
gases is not as big. Reductions in particle concentrations may exacerbate
global warming.